

Contents
Meiosis and Genetic Recombination
Background:
Overview of Meiosis: In this lab we will examine cell division by meiosis. Meiosis, unlike mitosis, results in a change in ploidy among daughter cells. In diploid species such as humans, meiosis results in in four (4) daughter cells that originate from a single diploid germ cell. In humans, all somatic (non sex cells) are diploid (2n) and contain two sets of chromosomes (2n = 46). Haploid cells (n = 23) are found only in gametes (sperm and egg). During the process of fertilization, the haploid genome of the sperm fuses with the haploid genome of the egg to return to the diploid state in the resulting zygote.
Also, unlike mitosis, meiosis is divided into two separate divisions termed meiosis I and meiosis II. Homologous chromosomes separate in meiosis I, whereas sister chromatids separate in meiosis II. Figure 1 illustrates both stages of meiosis using an example with 2n = 6. Unlike interphase, chromosomes are highly condensed during meiosis, which makes them clearly visible using standard light microscopy. Looking at metaphase I we can see that homologous chromosomes pair up at the metaphasic plate. For example, the copy of chromosome 8 inherited from the father aligns with the copy of chromosome 8 inherited from the mother. This contrasts with metaphase in mitosis, where homologous chromosomes simply line up in a single line one chromosome wide. The pairing and random organization of homologous chromosomes along the metaphasic plate during meiosis I is one mechanisms that leads to daughter cells being genetically different from the parent cell. We can call meiosis the ‘reductional phase’ because it produces two haploid cells from a single diploid cell. Meiosis II is similar to mitosis in the separation of sister chromatids. Also, as in mitosis, during meiosis II chromosomes align into a single column during metaphase II. Take some time to make sure you understand Fig. 1 and the stages of meiosis, as it will be important for the lab activity.
.")
If you look closely at Fig. 1, you will notice that some chromosomes contain both blue and red segments. This is due to a process called ‘crossing over’ or recombination and occurs during prophase I. During crossing over, homologous portions of two chromosomes swap information, leading to chromosomes that contain a mix of alleles from both maternal and paternal chromosomes. For many species, crossing over is facilitated by the formation of a synaptonemal complex, which helps bind the arms of homologous chromosomes. By examining the rate of recombination among alleles, researchers can construct a linkage map that shows the position of genes relative to one another along a chromosome. This is because the probability of recombination is proportional to the distance separating two genes along a chromosome. In other words, alleles at two genes that are physically close together on a chromosome are more likely to be inherited together versus alleles separated by a large distance. Let’s take a look at another example in Fig. 2.
.")
Here, we are working with four genes we will call Gene A, Gene B, Gene C, Gene D. This particular individual is homozygous for Gene A, heterozygous for Gene B, heterozygous for Gene C, and heterozygous for Gene D. The maternal chromosome originally contained the alleles A, B, C, and D, whereas the paternal chromosome contained alleles A, b, c, and d. Following recombination, the d allele becomes associated with the A, B, and C alleles on one maternal chromatid. Further, the D allele becomes associated with the A, b, and c alleles on one of the paternal chromatids. Thus, there is a new ‘combination’ of alleles that will be transmitted to daughter cells and eventually to sperm or egg.
In Fig. 3 we can add another gene, Gene E that is in close proximity to Gene D. Because these two genes are so close to one another, the likelihood that recombination will occur between them is minimal. Thus, alleles present at both genes will tend to be linked, or always inherited together. For example, the D and E alleles will be inherited and the d and e alleles will be inherited (never D and e or e and D). Because these alleles tend to be present in particular combinations in offspring, we can deduce that the genes must be in close proximity on the chromosome.
.")
Biology of Sordaria fimicola: In this lab we will be working with cultures of the fungus Sordaria fimicola. This is a species of fungus that is commonly used in genetics labs to illustrate properties of meiosis and recombination. The fungus is commonly found in the dung of herbivorous animals. Sordaria belong to a phylum of fungi called Ascomycota (sac fungi). Reproduction occurs sexually via the production of haploid spores called ascospores. These ascospores are contained in a structure inside the fungus called an ascus. All of these structures are contained in a perithecium. Each ascus contains eight ascospores that get released into the environment. Wild-type spores are a dark color, whereas mutant varieties are tan or gray. The full sexual and asexual life cycle of a typical ascomycete fungus is shown in Fig. 4.
.")
Focusing our attention on the sexual life cycle, we start with the fusion of hyphae from different mycelia. Following mitosis, this results in the production of a fruiting body called an ascocarp. Inside the ascocarp are many dikaryotic cells containing unfused nuclei. Upon fusion of nuclei (karyogamy) in the ascus, a diploid zygote is produced. This zygote undergoes meiosis to produce four haploid nuclei that subsequently undergo mitosis to produce eight haploid ascospores. These spores get released into the environment and germinate into a new haploid mycelium.
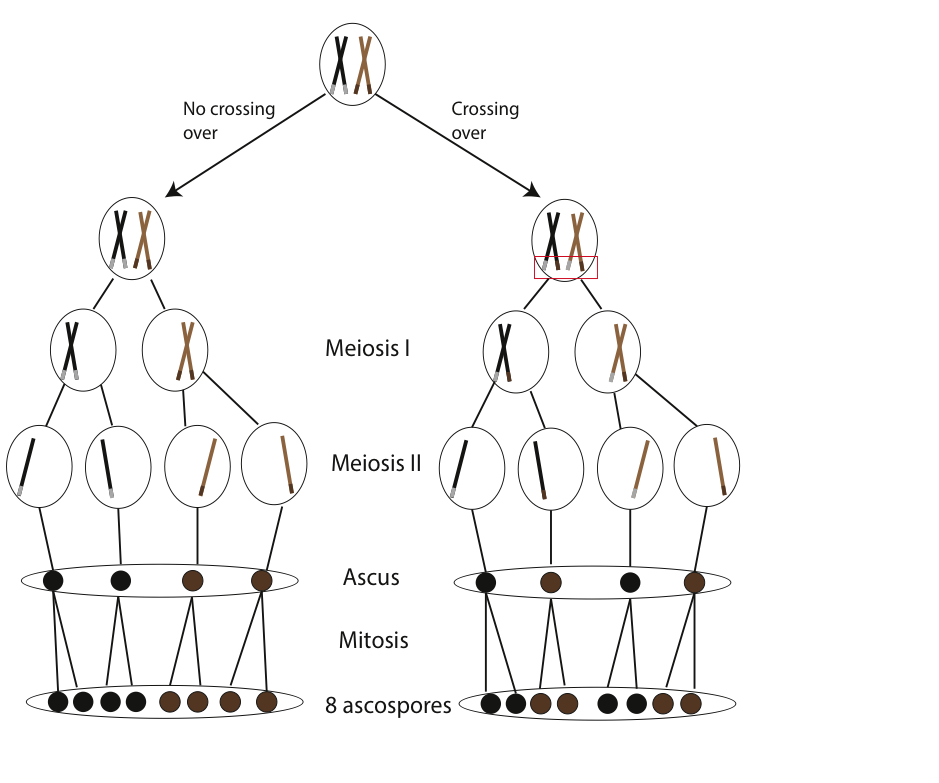
If no recombination (crossing over) has occurred for genes controlling ascospore color, we anticipate an ordered 4:4 ratio of wild-type to mutant spore color following a cross between strains (Fig. 5). Conversely, if crossing over did occur, we would expect deviations from the 4:4 ratio (e.g. 2:2:2:2 or 2:4:2).
The goal of this laboratory is to use cultured Sordaria to better understand meiosis and genetic recombination, and how meiosis can lead to offspring that differ genetically from parents.
Week 2 – Preparation of crosses (this is what was completed the previous week):
Our technicians have already prepared cultures of three types of Sordaria (wild-type, mutant tan, and mutant gray). In the lab you should see six dishes, two containing the wild-type strain, two with the tan strain, and two with the gray strain. Your job is to set-up crosses of these different strains to determine the proportion of asci containing “hybrid” ascospores that are a result of crossing over during prophase I of meiosis. You will have multiple dishes containing agar that will be used to perform your experiment.
- Use alcohol to disinfect all work surfaces and wash your hands.
- Obtain a petri dish containing the Sordaria crossing agar to make your crosses. Remember that we are making crosses between wild-type and gray and wild-type and tan strains. For simplicity, I recommend using separate plates for the tan and gray mutants. For example, one dish will be a wild-type vs. tan cross and another dish will contain wild-type vs. gray cross.
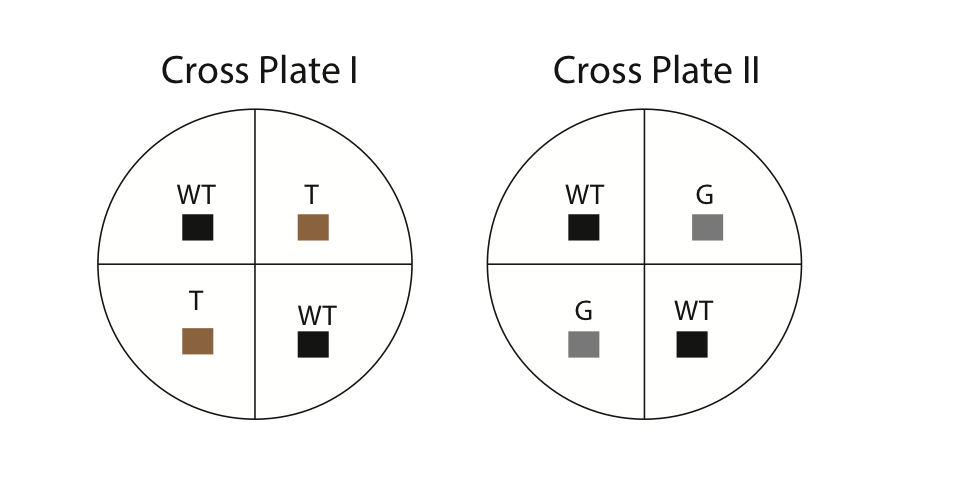
- Using a marking pencil, invert your dish and draw four equal quadrants. Label two of the quadrants as wild-type and two as mutant (either gray or tan). Refer to Fig. 6 for an example. Also, make sure to write your names and the date on your dishes.
- Using a sterilized wooden splint, cut small 0.5 cm cubes from the stock culture dishes. It is important to sterilize all equipment to minimize contamination. The common procedure for sterilization is to dip a utensil (e.g. scalpel) into alcohol and then flame it over a Bunsen burner. In our case, the wooden splits are already sterilized. Carefully invert the cubes (hyphae side down) and place them in the correct location on the cross plates. For example, you will cut out a 0.5 cm cube from the tan strain and place it in one of the quadrants labeled “tan” on your cross plate. Each culture plate should contain four cubes (two wild-type and two mutant [either tan or gray, but not both]). Using the side of your splint, gently press the cubes onto the agar so they stick. Next, apply some parafilm and seal the outside of your dishes.
- Incubate the dishes at room temperature for 1 week.
Week 3 – Microscopic examination of crosses:
This week we will examine the results of the genetic crosses we made between wild-type and mutant Sordaria strains during the previous week. Your goal is to determine if asci show signs of genetic recombination, based on the expected distribution of spore color. Remember, we expect a 4:4 wild-type to mutant distribution in asci that did not undergo crossing over. Follow the instructions below to visualize the asci.
- Use alcohol to disinfect all work surfaces and wash your hands.
- Working in groups of two, obtain a compound light microscope, glass slides, cover slips, water dropping bottles, and sterilized toothpicks.
- Using a sterilized tooth pick, remove a few perithecia from the cross plate and create a wet mount. You can find the perithecia near the junction of the different strains. To create a wet mount, gently rub the tip of the toothpick on a glass slide to remove the perithecia. Next, place a drop of water on your specimen.
- Using a cover slip, gently press down on the perithecia until they rupture and release the asci. Note that putting too much pressure will force the ascospores out of the ascus, making it impossible to draw any conclusions from the experiment.
- Observe the asci and ascospores under low magnification. Remember that wild-type spores should be a dark color, whereas the two mutant strains will be tan or gray. Next, try switching to high power magnification to view the ascospores more closely. Remember, crossing over has occurred in asci demonstrating either a 2:2:2:2 or 2:4:2 color pattern. Refer back to Fig. 5 to review how and when crossing over takes place.
- Each group should count 200 asci, keeping track of how many show evidence for recombination and how many do not.
- We can actually use the frequency of crossing over to estimate the relative position of the genes on the chromosome with respect to the centromere. This is because there is a direct relationship between recombination rate and distance between two points (genes) along a chromosome. Fill out the table below with your data.
| Strains Crossed | # Non-recombinant asci | # Recombinant asci | Total asci | % Recombinant | Map Units (% Recombinant/2) |
| Wild-type x gray | |||||
| Wild-type x tan |
Review questions:
- Compare and contrast mitosis from meiosis. In your answer, make sure you address why mitosis generally results in two genetically identical daughter cells, whereas meiosis leads to genetic variation. Feel free to use drawings in your answer.
- Meiosis is involved in the process of sexual reproduction. Sexual reproduction can lead to offspring that differ genetically from parents. What are the benefits of sexual reproduction and increased genetic diversity? What are the potential costs of sexual reproduction? Can you think of a real-world example that might favor asexual reproduction?
- In your own words, describe the typical sexual life cycle of Sordaria. Make note of which stages are haploid, diploid, and dikaryotic. Are ascospores produced by meiosis or mitosis? Explain your reasoning.
- Based on what you know of mitosis and meiosis, complete the following sentence:
Crossing over occurs during the _____________ stage of ____________.
- Discuss the relationship between recombination rate and the position of genes along a chromosome. Would a high recombination rate indicate that two genes are close together or far apart along a chromosome? Explain your answer.

