Tag Archives: demographics

NYT: “Younger Turn for a Graying Nation”

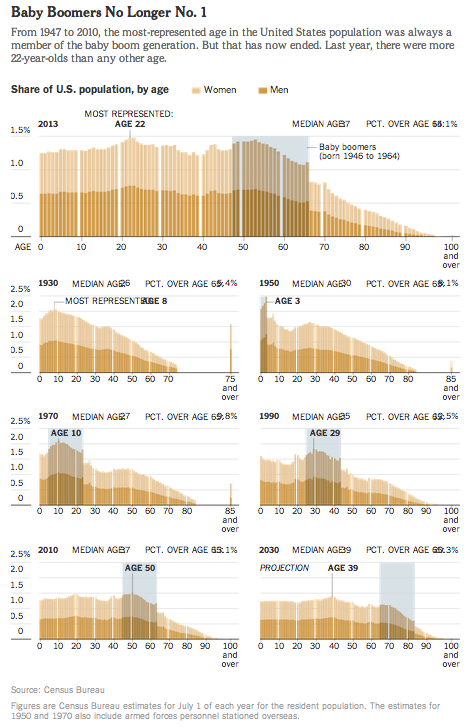
Following up on the histograms showing the age distributions of the US population over time that we discussed in class, here is a related set of histograms that were featured in the NYT Business section a couple months ago, as part of an article titled “Younger Turn for a Graying Nation“:

NYT-graying

That was an installment of a weekly column in the NYT Business section titled “Off the Charts,” which discusses a graph and the underlying data every Saturday.

Example: Histograms Showing “The Aging of America”

We discussed frequency distributions and histograms last week, and they will be central concepts in the course. Here is the example I showed in class from the New York Times’ website, which shows the age distributions of the US population over time, as well as a similar link from the Washington Post:

  1. From the New York Times: “The Aging of America
  2. Via the WashingtonPost’s Wonkblog: “This is a mesmerizing little animation created by Bill McBride of Calculated Risk. It shows the distribution of the U.S. population by age over time, starting at 1900 and ending with Census Bureau forecasts between now and 2060.”

What do you notice about how the distributions evolve over time? Click thru to either the CalculatedRisk blog post on which this animation first appeared or to the WashingtonPost link to read some discussion.