Chromatography is a collective term for a set of analytical techniques used to separate mixtures. Chroma means color and graph means to write or draw. Paper chromatography is an analytical technique used to separate mixtures of chemicals (sometimes colored pigments) using a partitioning method. The paper in this method is called the stationary phase because it does not move and serves as a substrate or surface for the separation. Analytes (substances being analyzed) are separated from each other based on a differential affinity to a solvent. The solvent dissolves and carries the analytes along the matrix of the stationary phase. Since the solvent moves through a wicking action, it is called the mobile phase.
The distance that the analyte migrates along the paper related to the total distance that the solvent or mobile phase moves is called the Retention Factor or Rf.
We can call any compound that adds H+ ions (a free proton) into solution an acid. Along with this, we would expect that any compound that would decrease the concentration of free H+ of a solution as a base. pH is the power of H+ of a solution. We define this power as a molar concentration of H+ in solution. This concentration invariably ends up being a relatively small number (though great in absolute numbers) and is expressed as a decimal number. Because the range of the concentrations is so great, we express these numbers as logarithmic numbers to avoid writing many 0’s after the decimal and to facilitate communicating the concentration. Since these numbers are so (relatively) small, we use the negative logarithm to describe this concentration.
Mathematically defined,
The pH scale ranges so that anything below pH 7 is acidic and anything above pH 7 is alkaline. So a smaller number is more acidic. But didn’t we just state that something acidic contains more H+ ions? Remember, because we are dealing with a negative Logarithm, this means the concentration is higher.
Logarithmic Scales
If we have a quantity that is 102, we know that translates into 100. Just as if we have a quantity of 104, we know that translates into 10000. Just as it becomes inconvenient to keep writing all those 0’s, it’s really impractical to write many many 0’s after a decimal. It’s really hard to talk about too! So we likewise will express numbers like 0.0001 as 10-4. A logarithm is the reverse function of an exponent. Therefore:
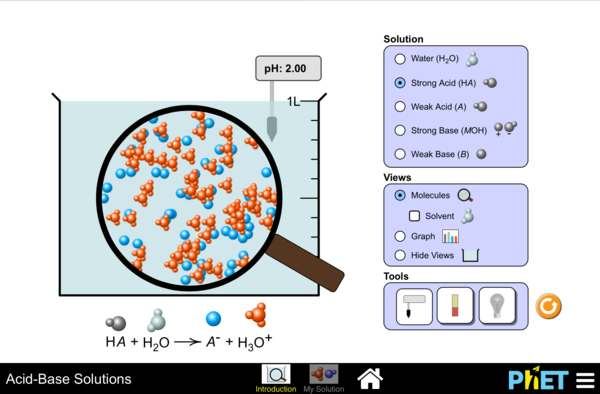
So how do we define a solution that is pH 2? Well, we already decided that this solution is below pH 7 — making it an acid. But what does this mean in terms of H+ ion concentration?
Let’s work this out algebraically:
Let’s bring the (-) over to the other side
Now let’s reverse the Log → base 10
Plug in the pH → molar concentration of [H+]
As we can now see, a solution of pH 2 is acidic because the molar concentration of [H+] is 10-2mole/L or 0.01M
Dissociation of ions: That number is small!
It’s not a small number. Remember that a mole is 6.022 X 10²³. That’s a very large number! Think about it! A solution of pH 4 is acidic, but if we plug in the formula, we realize that this is equal to 0.0001M H+ – less than pH 2 at 0.01M!
But let’s compare it to the [H+] content of H2O. Now I’m going to sound crazier! Water can be thought of as being in an equilibrium where some of the molecules are ionizing and deionizing. We can express this in 2 ways:
H2O ⇋ H+ + OH–
2H2O ⇋ H3O+ + OH–
So at any given point, a liter of H2O at neutral pH (7) has 10-7 moles of H+ ions. Incidentally, it also has 10-7 moles of OH– in solution. The second expression indicates the formation of a hydronium ion (H3O+) instead of a free proton in solution. So something that is pH 2 is a stronger acid than pH 4, right? Nope. That just indicates the amount of free protons in solution. It is more acidic but acid strength means something else. When we talk about strong acids, it means that it is more likely to donate a proton to the solution because it is more likely to ionize. Let’s look at the following:
HA ⇋ H+(aq) + A–(aq) Where HA is an acid dissociating in solution
If this dissociation is very high, then we say that it is a strong acid. Similarly, a compound like NaOH readily dissociates completely in solution and provides OH– ions that can readily remove H+ from solution –a strong base! We speak of dissociation in terms of rates and we express this as the acid dissociation constant, Ka. This is calculated using the concentrations of [H+] (proton), [A–] (conjugate base) and [HA] (non-dissociated) at equilibrium:
Just like the orders of magnitude we have when discussing pH, the rates of dissociation are more conveniently communicated on a logarithmic scale.
Think about it this way, if the concentration of the dissociated ions is very high, the numerator in the rate is very high → Ka is great. In other words, at equilibrium, the dissociation reaction looks more unidirectional than bi-directional as the compound is readily ionized:
HA → H+(aq) + A–(aq)
On this scale, we refer to anything with a pKa < -2 as a strong acid since it will readily dissociate in solution. This form of the dissociation constant is extremely useful in estimating the pH of buffered solutions and for finding the equilibrium pH of the acid-base reaction (between the proton and the conjugate base). We can estimate the pH by utilizing the Henderson-Hasselbalch Equation:
Buffered Solutions
Titration of an acid by a baseA buffer is something that resists change. A buffered solution is one that consists of a weak acid or weak base that will control the pH of a solution. Imagine a buffer to be a reservoir of available H+ or OH- ions. If a buffered solution is pH 2, adding a basic solution to it will not cause a drastic change to the pH because the reservoir of H+ will continuously neutralize the base. Eventually, this store or reservoir of H+ will be depleted. When this happens, the pH will suddenly change. The range in which acid or base is added without a significant change in pH is called the buffered zone or the buffering capacity. When this store of H+ or buffering capacity is expended, we have reached the equivalence point that describes the point at which the base has completely neutralized the weak acid.
The solution has a good buffering capacity between pH 3 and pH 5
Acids and Bases Simulation
Click on image above to run the simulation on Acids and Bases
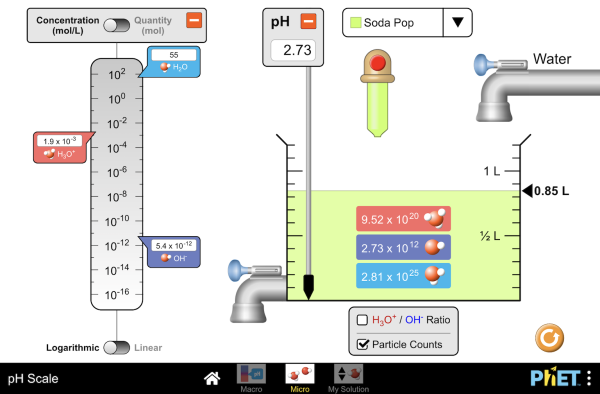
pH simulation
Click to Run
Click on image above to run the simulation on Acids and Bases
pH of common items
Use the table below to indicate whether an item is acid or base and what you predict the pH to be. We can determine these in class through measuring.
Experimental science looks at cause and effect types of relationships. Controlled experiments vary one of the factors or traits to observe the effect on another factor or trait. These factors are called variables. A dependent variable is something that is observed and expected to change as a result of modifying another factor in the experiment. That is to say, the outcome depends on another factor. The independent variable is the factor or condition that is changing or being changed by the experimenter. Sometimes waiting is the the condition that is changing, making the independent variable: time.
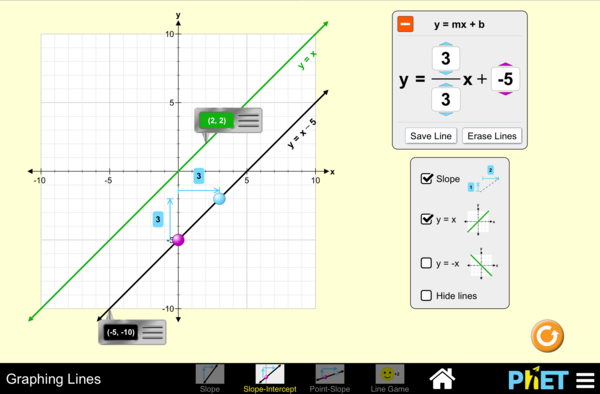
Graphing a line
A graph displaying 2 lines and their equations
A line can be described mathematically by the equation:
y = mx + b
This is referred to as the slope-intercept form. The 2 variables y and x refer to coordinates along each axis. The term m refers to the change in the y-values over the change in the x-values. This is referred to as the slope of the line. The term b, the y-intercept, is the y-value where the line crosses the y-axis.
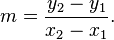
This is how the slope of a line (m) is determined.
The slope of the line indicates the relationship between the two variables, x and y. The equation of the line y=mx+b indicates to us that “y” occurs as a function of changes to “x”. Sometimes this is represented by the equation f(x)=mx+b . Since “y” depends on “x”, “y is the dependent variable and “x” is the independent variable. As “x” changes, how does “y” change in response? This is what the slope reveals to us.
Light is a type of energy that travels as a wave-particle.The wavelength of light is the distances between peaks in the waves as light travels. Wavelengths are measured in nanometers (nm) and different wavelengths of light represent differing colors. White light is a mixture of the visible light spectrum. Light of long wavelengths (infra-red) and very short wavelengths (ultra violet) are invisible to humans but can be observed by other organisms. As wavelength decreases, the energy of the light is increased.
Diffraction of light through a prism exposes the components wavelengths of light.
Spectrophotometry
Spectrophotometers (spectro-image/color ; photo-light ; meter-measure) are used for chemical analysis of solutions based on properties of absorption or transmission.
Schematic of a spectrophotometer. The monochromator is a prism that splits the light. A single wave-length of light is focused through the aperture to pass through the solution in the cuvette.Transmittance refers to the amount of light that passes through the solution.
Transmittance of a light source through a cuvette. The intensity of light, I0, decreases as it passes through the solution. The light detected by the sensor, I, reflects the transmittance of the solution.
If light is being absorbed by chemicals in the solution, this results in a lower transmission. Absorbance is therefor inversely related to transmittance as expressed by the equation:
Beer’s Law is a relationship between the concentration or amount of a dissolved substance in a solution that is reducing the amount of transmitted light due to the absorption of the radiant energy. Lambert’s Law states that the reduction of transmittance was related to the length of the path of light. As the light path increases through a substance, there is a reduction in transmittance. Collectively, these ideas are referred to as Beer-Lambert Law, but most observers will control the path length and simply refer to it as Beer’s Law.
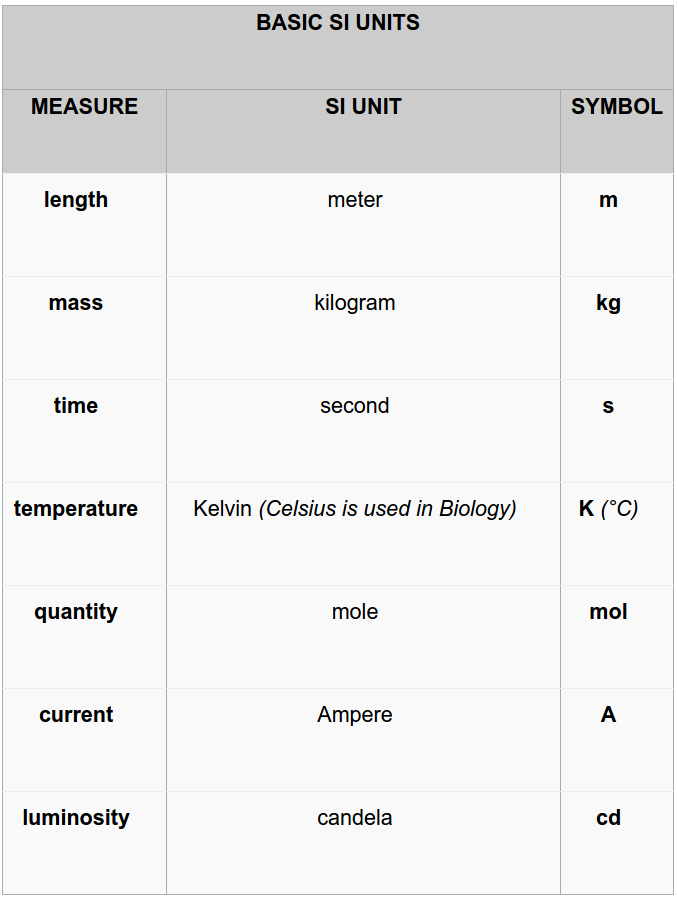
The metric system is an internationally agreed upon measurement system based on decimals or powers of 10. Scientists use a refined version called the International System of Units (abbreviated SI). In biology, you will often find a need to describe measurements of length, volume, mass, time, temperature or amount of substance.
International System of Units
Metric Units:
length: meter (m)
volume: liter (L)
mass: gram (g)
time: second (s)
temperature: Celsius (°C)
Kelvin (K) is a unit of thermodynamic temperature and is the SI unit. The Kelvin scale in the same as the Celsius or centigrade scale but offset by 273.16
Biology uses Celsius predominantly because of the range in which organisms live.
amount of substance: mole (mol)
A mole is a number representing 6.022×10²³ of something
Just as a pair of shoes equals 2 shoes, a mole of shoes is 6.022×10²³ shoes
Just as a dozen eggs equals 12 eggs, a mole of eggs is 6.022×10²³ eggs
The difference in nucleotide sequences between humans lies between 0.1-0.4%. That means that people are greater than 99% similar. But when you look around the room at your classmates, you can see that that small difference amounts to quite a bit of variation within our species. The bulk of these differences aren’t even within the coding sequences of genes, but lie outside in regulatory regions that change the expression of those genes. Imagine if there were mutations to the coding sequences, this could be very deleterious to the well-being of the organism. We say that the coding sequences of genes that ultimately lead to proteins has a selective pressureto remain the same. The areas outside of the coding sequences have a reduced and sometimes non-existent selection pressure. These areas are allowed to mutate in sequence and even expand or contract. Areas of changes or differences are called polymorphic(many forms). If you were to read a repetitive set of sequences and count the repetition, you’d make mistakes and lose count. Likewise, DNA
polymerase will make errors or stutter in areas of repetitiveness and produce polymorphic regions.
Tandem Repeats
A type of polymorphism occurs due to these repeats expanding and contracting in non-coding regions. These regions are called variable number tandem repeats (VNTRs)
or sometimes short tandem repeats (STRs). Any region or location on a chromosome is referred to as locus(loci for plural). Scientists use polymorphic loci that are known to
contain VNTRs/STRs in order to differentiate people based on their DNA. This is often used in forensic science or in maternity/paternity cases. Any variation of a locus is referred to as an allele. In standard genetics, we often think of an allele as a variation of gene that would result in a difference in a physical manifestation of that gene. In the case of STRs, these alleles are simply a difference in number of repeats. That means the length of DNA within this locus is either longer or shorter and gives rise to many different alleles. VNTRs are referred to as minisatellites while STRs are called microsatellites.
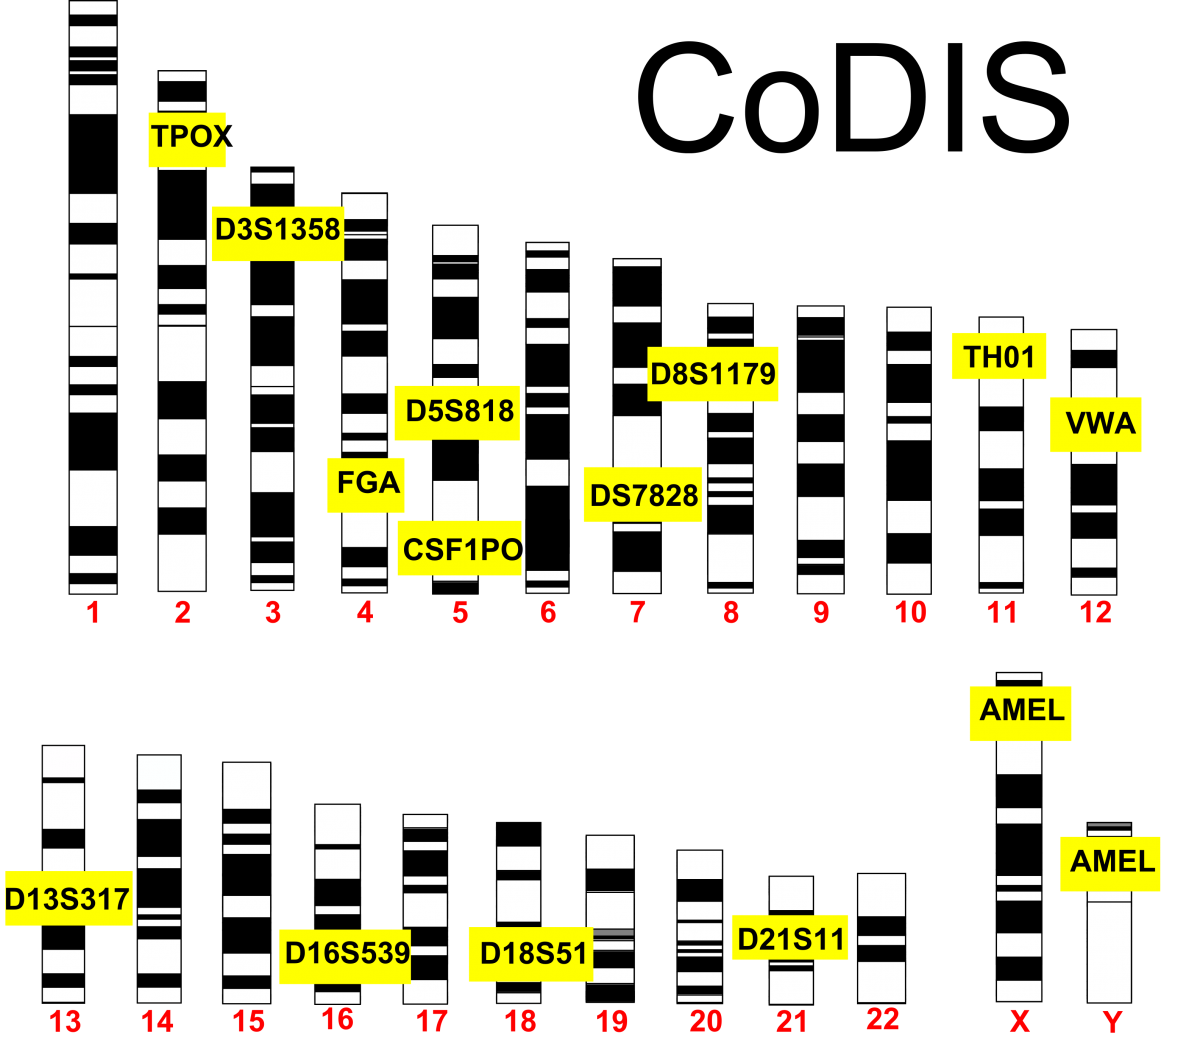
CoDIS
The FBI and local law enforcement agencies have developed a database called the Combined DNA Index System (CoDIS) that gathers data on a number of STRs. By establishing the number of repeats of a given locus, law enforcement officials can differentiate individuals based on the repeat length of these alleles. CoDIS uses a
set of 13 loci that are tested together. As you would imagine, people are bound to have the same alleles of certain loci, especially if they were related. The use of 13 different loci makes it statistically improbable that 2 different people could be confused for each other. Think about this in terms of physical traits. As you increase the number of physical traits used to describe someone, you are less likely to confuse that person with someone else based on those combinations of traits. Using the CoDIS loci increases the stringency since there are many alleles for each locus. The thirteenth locus in CoDIS (called AMEL) discriminates between male and female.
CoDIS STRs: The FBI utilizes 13 different loci to discriminate between people. AMEL discriminates by gender and is located on the X & Y.
Crime Scene Investigation
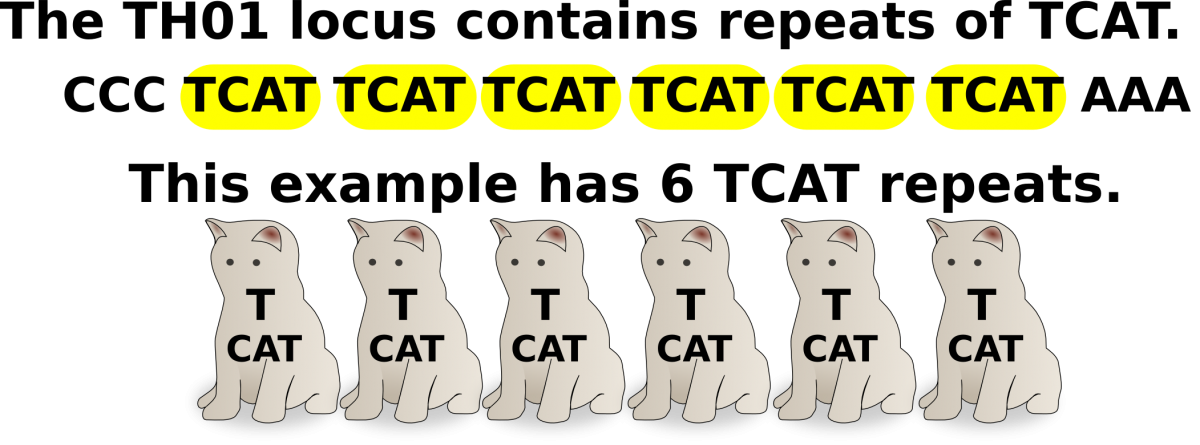
This lab uses a CoDIS locus called TH01. TH01 is a locus on chromosome 11 that has a repeating sequence of TCAT. There are reported to be between 3-14 repeats in this locus. With the exception of X and Y in a male, all chromosomes have a homologous partner. Therefore, each individual will have 2 alleles for each CoDIS locus.
TH01 STR: Outside of the STR, there is flanking areas of known sequence. The primers that amplify TH01 in PCR recognize these flanking sequences to amplify the TCAT repeats.
At a crime scene, criminals don’t often leave massive amounts of tissue behind. Scant evidence in the form of a few cells found within bodily fluids or stray hairs can be enough to use as DNA evidence. DNA is extracted from these few cells and amplified by PCR using the specific primers that flank the STRs used in CoDIS.
DNA evidence from a crime scene: DNA can be extracted from cells found from various sources at a crime scene. PCR can amplify this small amount of DNA.
Amplified DNA will be separated by gel electrophoresis and analyzed. Size reference standards and samples from the crime scene and the putative suspects would be analyzed together. In a paternity test, samples from the mother, the child and the suspected father would be analyzed in the same manner. A simple cheek swab will supply enough cells for
this test.
TH01 locus used in a Paternity/Maternity test: Individual PCR reactions are run for each sample (mom, dad, child). The TH01 primer pair specifically amplifies the locus. Each amplified sample is run on the same gel to resolve the different alleles of TH01 from each individual. From this test the sample could be the offspring from these 2 parents but use of more STRs would make it more definitive. Count the TCATs.
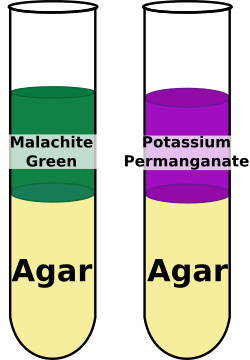
Agar is a gelatinous substance derived from a structural carbohydrate found in seaweed. It is often used in cooking as a vegetarian alternative to gelatin and can be used as a thickener. Microbiologists pour plates of agar containing nutrients in order to isolate and grow bacteria and other microbes. As with gelatin, the long fibery nature of this structural carbohydrate permits it to be melted and tangled together in a mesh-like network where the spaces between molecules are filled with solution. Altering the amount of fluid solution will change the pores between fibers. More fluid will create a looser gel that has larger spaces between molecules. Reducing the fluid solution volume will conversely create a stiffer gel with smaller spaces between fibers.
Take 2 tubes of agar and a solution of Malachite green (365 g/mole) and a solution of Potassium permanganate (164 g/mole)
Mark the top of the agar on the outside of the tube (the starting point)
Add 10 drops of malachite green to one tube and 10 drops of Potassium permanganate to the other
Take note of the time
At 20 minute intervals, measure the distance from the top that the agar has moved. Do this for at least 1 hour.
Plot the data and compare the trends. Describe the rate of diffusion for each.
Stop and Think:
Hypothesize which solution will move faster through the agar and provide a reason.
Illustration of Hooke’s microscopeIn 1665, Robert Hooke published Micrographia, a book that illustrated highly magnified items that included insects and plants. This book spurred on interest in the sciences to examine the microscopic world using lenses but is also notable for Hooke’s observations of cork where he used the word “cell” in a biological sense for the first time.
The empty chambers of cork inspired Hooke to coin the term “Cell”
The father of Microbiology: van Leeuwenhoek
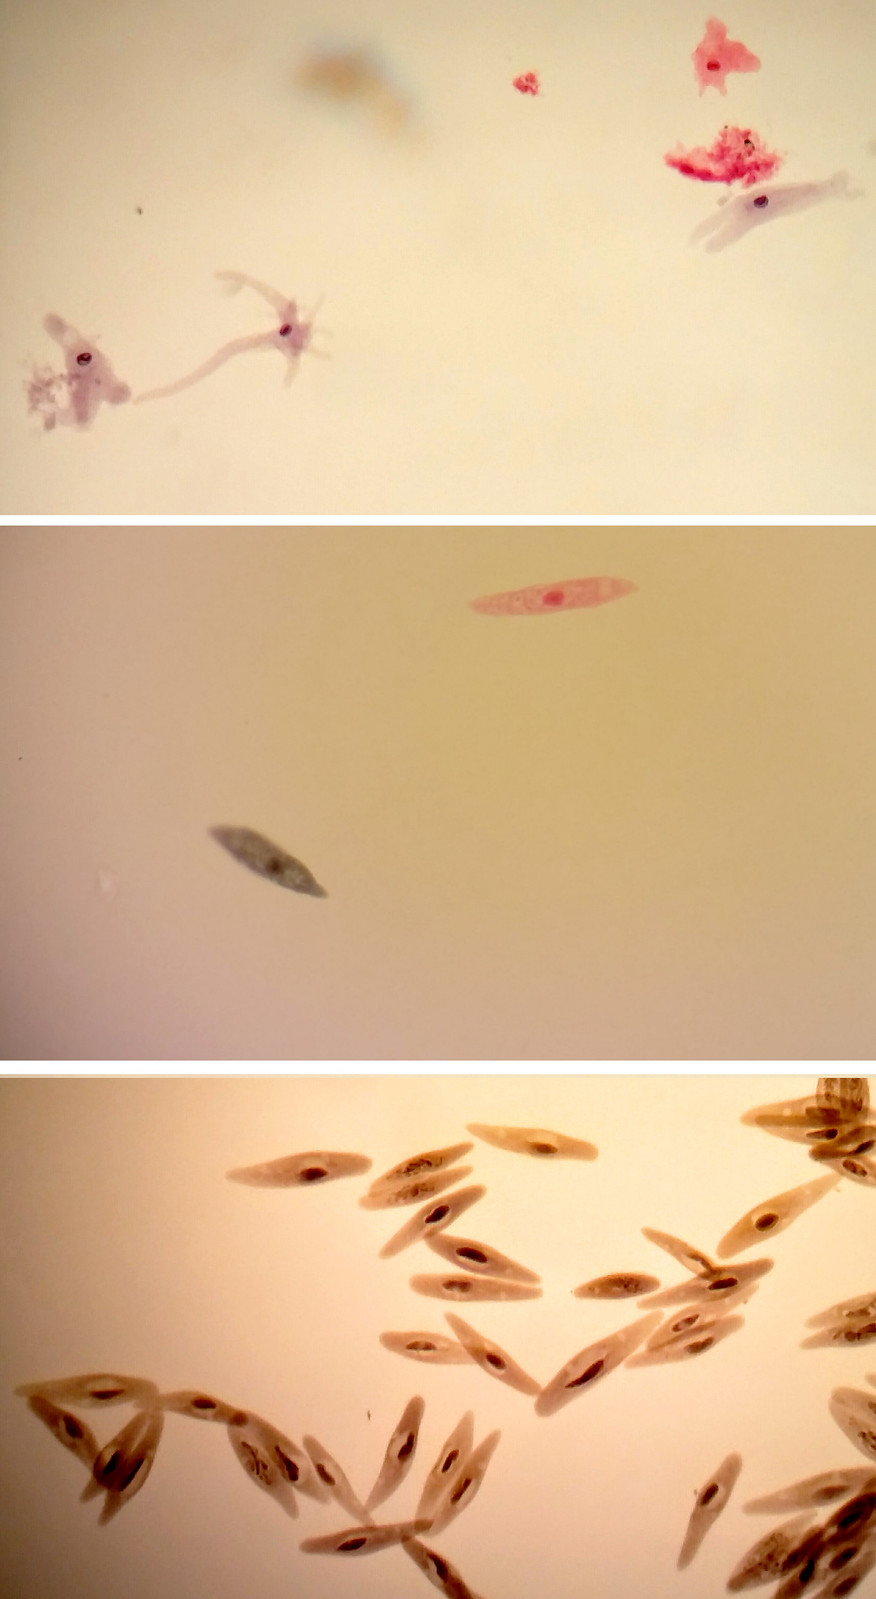
van Leeuwenhoek’s microscopeThe Dutch tradesman Antonie van Leeuwenhoek used high power magnifying lenses to examine the parts of insects and to examine the quality of fabric in his drapery business. He began to experiment with pulling glass to generate lenses and developed a simple microscope to observe samples. Using a simple single lens with a specimen mounted on a point, he was able to identify the first microscopic “animalcules” (little animals) that will be later known as protozoa (original animals).
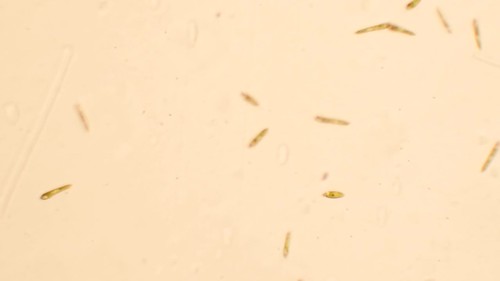
Though van Leeuwenhoek’s apparatus was simple, the magnifying power of his lenses and his curiosity enabled him to perform great scientific observations on the the microscopic world. He was ridiculed for fabricating his observations of protists at first. Ever the scientist, van Leeuwenhoek examined samples of his own diarrhea to discover Giardia intestinalis. While he did not make the connection of the causative nature of this microorganism, he described the details of the way this organism could propel itself through the medium in great detail.
Modern micrograph of Giardia intestinalis (Kingdom Protista)
Modern Compound Microscope
Unlike van Leeuwenhoek’s single lens microscope, we now combine the magnifying power of multiple lenses in what is called a compound microscope.
Ocular lens or eyepiece
Nose Piece/ Lens Carousel
Objective lens
Course Focus Knob
Fine Focus Knob
Stage
lamp
condenser
stage control
Using the Light Microscope
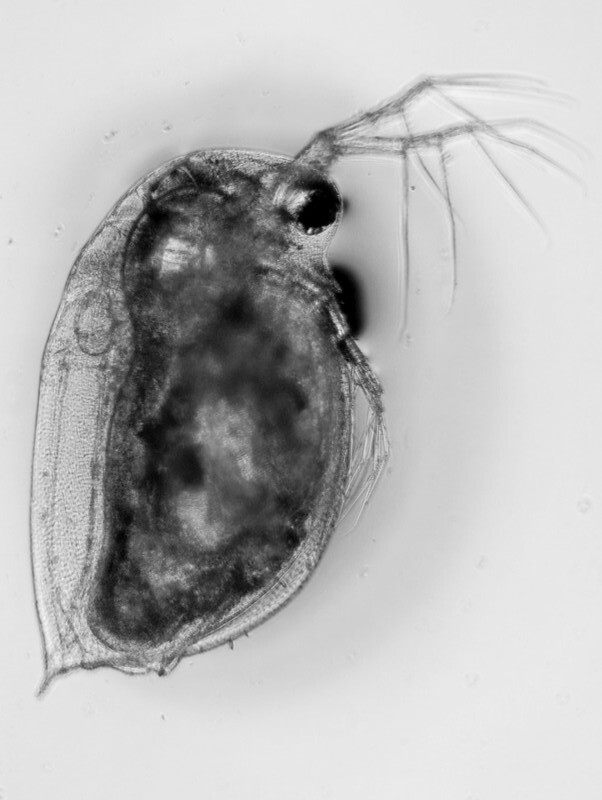
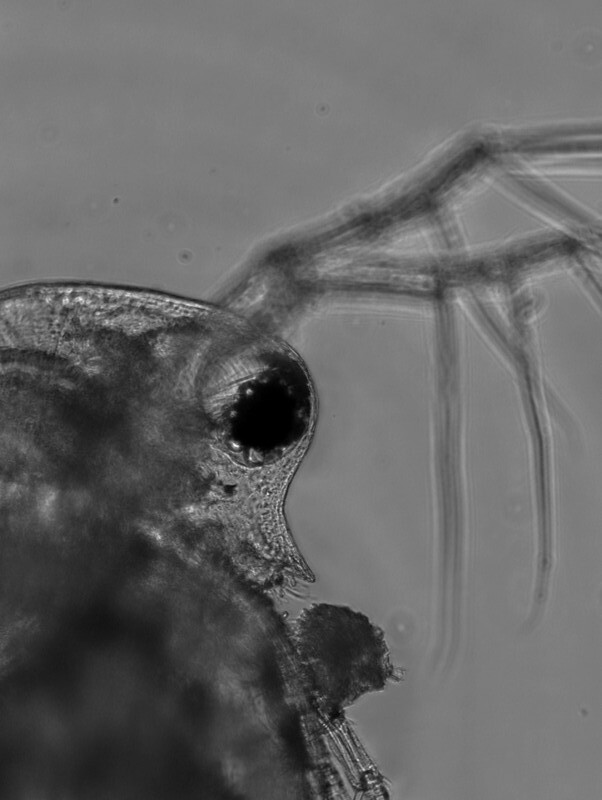
Microscopic World
Daphnia magna, the freshwater flea is a small crustacean (scanning magnification) Low magnification of Daphnia magna


=-4")
=-4")


![K_{a} = \frac{[{H}^+][{A}^-]}{[{HA}]}](https://s0.wp.com/latex.php?latex=K_%7Ba%7D+%3D+%5Cfrac%7B%5B%7BH%7D%5E%2B%5D%5B%7BA%7D%5E-%5D%7D%7B%5B%7BHA%7D%5D%7D+&bg=ffffff&fg=000000&s=0 "K_{a} = \frac{[{H}^+][{A}^-]}{[{HA}]}")

![{pH} = {p}K_{a}+ \log_{10} \left ( \frac{[{A}^-]}{[{HA}]} \right )](https://s0.wp.com/latex.php?latex=%7BpH%7D+%3D+%7Bp%7DK_%7Ba%7D%2B+%5Clog_%7B10%7D+%5Cleft+%28+%5Cfrac%7B%5B%7BA%7D%5E-%5D%7D%7B%5B%7BHA%7D%5D%7D+%5Cright+%29&bg=ffffff&fg=000000&s=0 "{pH} = {p}K_{a}+ \log_{10} \left ( \frac{[{A}^-]}{[{HA}]} \right )")


.jpg)