Recombinant DNA technology has many uses in basic scientific research to better understand the nature of of living things. As a tool, recombinant DNA technology can be used to express proteins towards medical applications. Prior to biotechnology, type I diabetes (insulin-dependent) was treated by injection of insulin isolated from the pancreas of pigs. With the ability to express human proteins inside bacteria, yeast and other cells, sacrificing pigs for porcine insulin is no longer necessary.
Bacterial expression vector pGEX-3X contains the AmpR gene, origin of replication, MCS downstream of the hybrid lac/trp promoter (tac) and the coding sequence for glutathione-S-transferase (GST). GST acts as a tag that is fused directly with the protein from the gene of interest and used to purify the protein with a glutathione resin.
Bacteria or other cells can be engineered to express proteins through the process of cloning and transformation. Bacteria are advantageous because of their rapid life cycle and ease of growth. A bacterial expression vector contains the basic plasmid features: origin of replication as well as antibiotic resistance gene. Often, an affinity tag will be used to aid in purification of the protein. An example in the vector above shows the GST (glutathione-s-transferase) tag that can be purified with glutathione resin. Expression is only the first problem since bacteria are also synthesizing proteins that are required for the bacteria to grow and divide. Injecting these proteins in addition to insulin would cause an immune reaction that could be deadly. Therefore, it is required that overexpressed proteins be purified and isolated from other undesirable proteins.
Criteria for Choosing an Expression System
Protein expression systems have inherent advantages and disadvantages. The table above summarizes the comparison of the various cellular systems of production (Fernandez & Hoeffler, 1999).
A bioreactor or fermenter that is used to grow large amounts of bacteria for the production of protein.
Purification
Different methods of isolation can be applied depending on the properties of the protein. Ion exchange chromatography is useful if the protein of interest has a specific charge that will interact with a resin packed with the opposite charge.
Immunoprecipitation
Immunoprecitation: Column is packed with Protein-A agarose which binds to antibodies. Cell lysates are then loaded onto the columns where they flow through and are allowed to interact with the antibody. Washes are performed to remove the non-specifically bound proteins. An elution buffer is used to disrupt the interaction of the antibody to the protein target.
Affinity Purification
Affinity purification employs the use of specific antibodies that bind to the protein of interest very tightly to retain it on a column. With these techniques, the protein retained on the resin is washed numerous times to remove other proteins that are non-specifically sticking. A change in pH or ionic conditions then is used to disrupt the interaction with the resin and elute the proteins from the column. Proteins that are engineered to contain tags can be purified by antibodies specific to those tags. Also, the addition of 6 or more consecutive Histidine residues to the end of a protein make them susceptible to purification with Nickel-NTA resin or Cobalt purification. In these cases, the 6XHis tag associates with these metal ions on the resin and are selectively adhered.
Nickel NTA resin coordinating the capture of a 6His tagged protein
Size Exclusion
Most of you are familiar with water purification filters. Before using these filters, you soak them in water and dark residue leaks out. This dark residue is activated charcoal. The activated charcoal has tiny microscopic pores that trap small items like ions and other particles. The primary goal of these filters is to remove metals and chlorine that are found in tap water. The porous nature of activated charcoal renders it useful for trapping molecules in water purification systems . The process used to trap these small particles is called size exclusion. Unlike agarose gel electrophoresis where the smaller particles navigate through the matrix faster, size exclusion resins trap the smaller molecules.
The smaller the molecule, the longer they spend within the pores as they traverse through the matrix.
Significance of Purification
All injectible drugs must be clean of endotoxins from bacteria. Purification of the protein of interest from bacterial lysates removes the dangerous pathogenic materials from that would otherwise activate host immune reactivity.
The horseshoe crab (Limulus polyphemus) performs a special function in the ecosystem by providing eggs for migratory birds to feed on. This organism also houses a special cell type in its hemolymph. The limulus amoebocyte lysate (LAL) test is the most sensitive assay of detecting endotoxins from bacteria. Amoebocytes are collected from these organisms for use on testing batches of injectible drugs to ensure proper purification and safety.
Morphometrics (morpho– shape; metrics– measurements) is the use of physical measurements to determine the relatedness of organisms. With extinct organisms that have died out long ago, DNA extraction proves to be difficult. Likewise, prior to DNA technologies to analyze species, Linnean taxonomy was ascribed to organisms based on similarities in features.
Describing Species and Variation of Morphologies
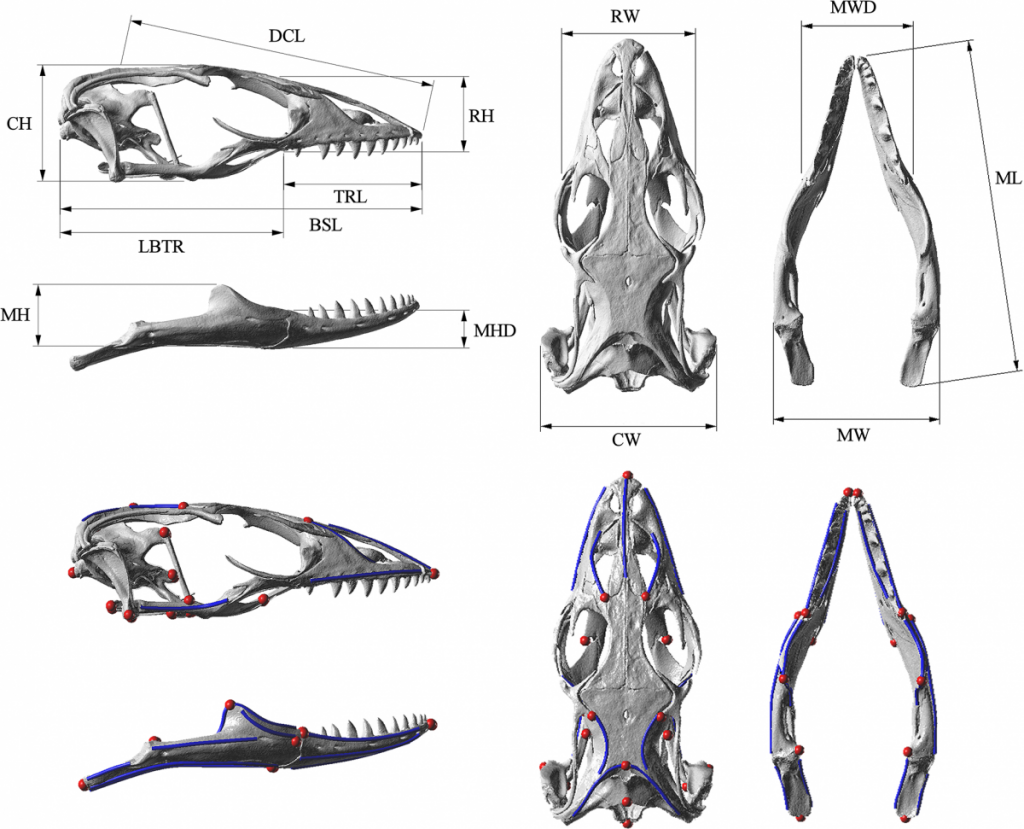
Below are images of skull landmarks of the lizard family Varanidae. This family includes monitor lizards and Komodo Dragons.As can be seen below, the general morphology of the skulls are similar enough that they all retain the same landmarks. The figure below also illustrates the diversity in these lizards that illustrate a large variety between species.
Having a set of shared landmarks provides the opportunity to make systematic measurements of morphometric features.
Landmarks and measurement metrics for the morphometric analysis of skulls. McCurry et al. (2015) (CC-BY)
Euclidean distance to measure relatedness
Euclidean distance is a measurement derived from Pythagorean geometry that describes the shortest distance (d) between 2 points (A & B) as a straight line using triangulation. In a cartesian space, the points can be defined:
and
Standard pythagorean theorem can be expressed as:
To find the distance between the 2 points, we utilize algebra to calculate for .
In this case, we expand to comparing the coordinates of the two points:
and
We can then expand this idea to include the differences of data points that describe the comparisons of multiple measurements.
Calculating distance with R
Download the dataset(McCurry et al. 2015) associated with this activity (a Comma Separated Value .csv file). This can be used in a spreadsheet or in a text editor. This data can be imported into R to determine the euclidean distances of landmarks.
The following code in R will download the data set into a variable called “varanoid”, measure euclidean distance and save a plot into a PDF file in a directory called “/tmp”.
## install curl for fetching from internet if it isn't
install.packages('curl')
## Load the curl library
library(curl)
## read the data of measurements and assign it to a variable 'varanoid'
varanoid = read.csv(curl('https://raw.githubusercontent.com/jeremyseto/bio-oer/master/data/varanoid.csv'))
## set the row names to the Species column
row.names(varanoid) = varanoid$Species
## remove the first column of the table to have purely numeric data
varanoid_truncated = (varanoid[,2:14])
## calculate distance using euclidean as the method
dist_measure = dist(varanoid_truncated, method='euclidean')
## display dist_measure to look at the comparisons
dist_measure
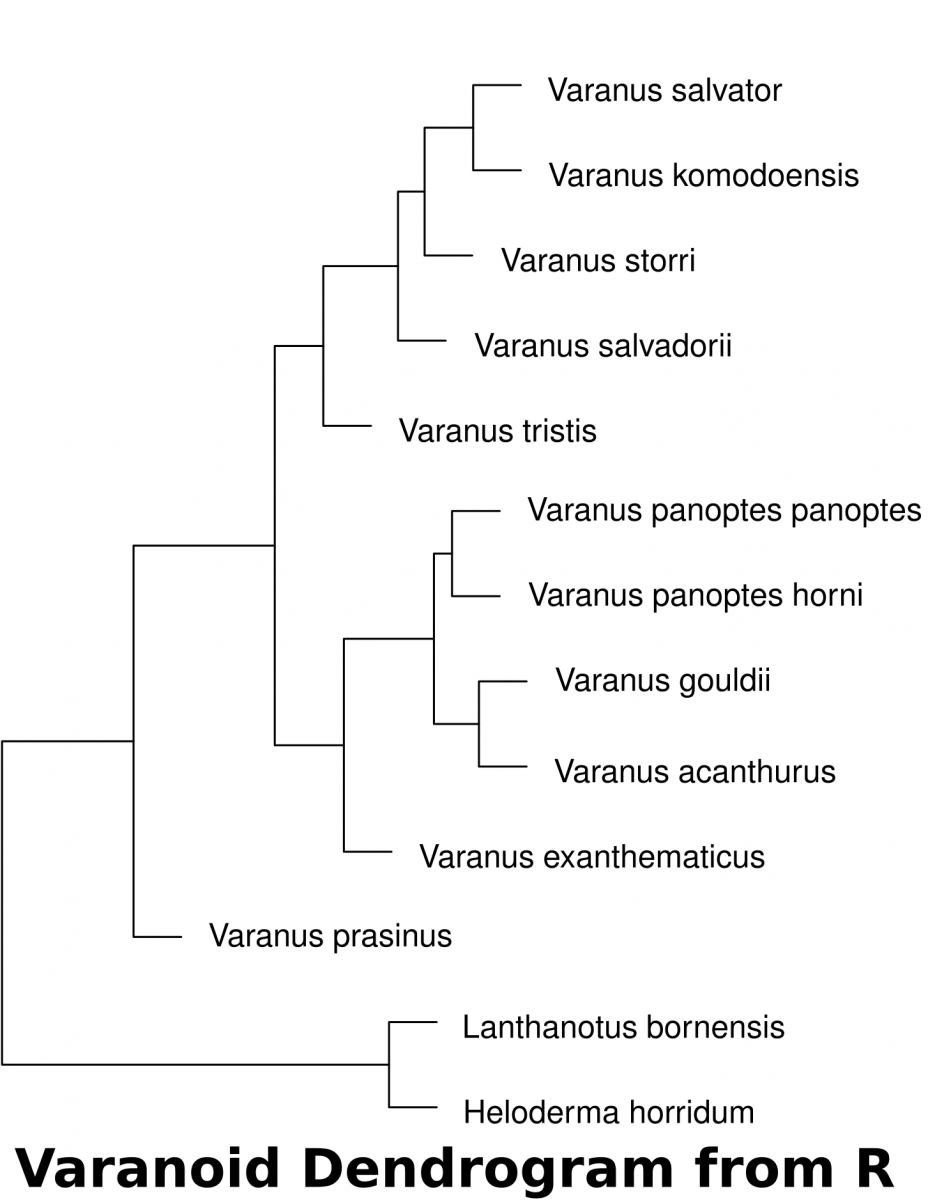
varanoid_cluster = hclust(dist_measure)
## open PDF as a graphics device to save a file in the '/tmp' directory
pdf(file='/tmp/varanoid_tree.pdf')
plot(varanoid_cluster)
dev.off()
## close the device to save the plot as pdf
Amylase is an enzyme that breaks down amylose (starch) into glucose molecules.
What test can be used to indicate the presence of Starch?
What test can be used to indicate the presence of glucose?
What is the role of an enzyme in a chemical reaction and what is it made of?
What parameters would influence the ability of the enzyme to facilitate the rate of the reaction?
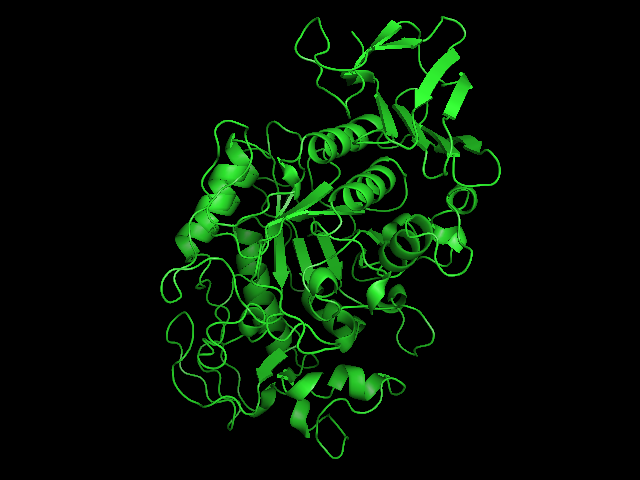
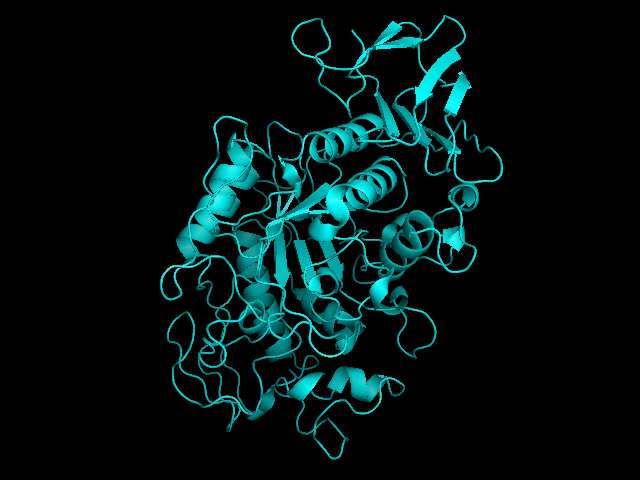
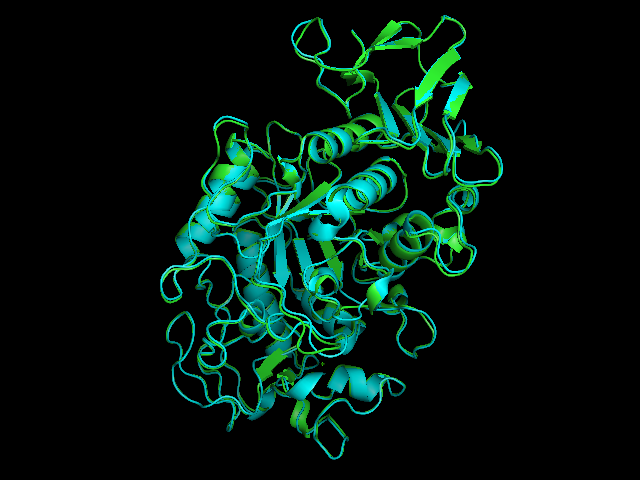
Salivary amylase is produced in the mouth, where digestion begins.Pancreatic amylase is produced in the pancreas and is supplied to the duodenum of the small intestines.Overlay of salivary (green) and pancreatic (teal) amylase molecules. Tags: quantitative reasoning, analysis, inquiry, integration of knowledge
In Biological systems, energy is roughly defined as the capacity to do work. Molecules are held together by electrons. Breaking and building these bonds requires an input of energy. The energy needed to initiate such reactions is referred to as activation energy (EA). Sometimes the necessary energy to initiate a reaction is so great, that it greatly limits the likelihood of the reaction ever occurring. Catalysts are chemicals that take part in facilitating reactions by reducing the energy of activation. If the activation energy is reduced, the likelihood of a reaction occurring is greatly enhanced. In cells, the catalysts are often made of proteins and called enzymes.
Reaction coordinate of an exothermic reaction with and without an enzyme. The enzyme reduced the EA to facilitate the likelihood that the reaction occurs. This catabolic reaction breaks complex things down, thus increasing entropy and releasing energy into the system.
Enzymes
Reactants in enzymatic reactions are called substrates. They have an imperfect fit to a binding domain of the enzyme called the active site. Substrate binding to this active site induces a change in the shape of the protein that coordinates the substrate into a transition state that will reduce the amount of EA required for the reaction to go to completion. The induced fit of the protein also aids in coordinating other cofactors or coenzymes that will aid in the reaction.
Induced fit model of enzymes and substrates. The active site of the protein is an imperfect match for the substrate. Intermolecular interactions between the enzyme and substrate induce a new fit that facilitates the formation of a transition state and results in the catalysis of the reaction.
The reaction follows the standard flow where the Enzyme (E) and the Substrate (S) interact to form an Enzyme-Substrate Complex (ES). The ES then dissociates into Enzyme and the resultant Product (P)
E+S⇒ES⇒E+P
The induced fit of the enzyme-substrate complex coordinates the transition state to facilitate the reaction. This induced fit occurs through non-covalent means that result in a tugging on the molecules (an application of energy) while molecules are coaxed into the reactions.
Hexokinase enzyme interacts with an ATP and a hexose. These interactions alter slightly the structure of the enzyme (induced fit). This pulling on the enzyme and the substrates aids in catalyzing the reaction through coordinating the molecules, sometimes with the aid of cofactors and coenzymes. The yellow sphere represents the cofactor Mg2+Coenzymes can be covalently linked to amino acid side chains of the enzyme and are also referred to as prosthetic groups. While prosthetic groups are organic in nature, they may also involve the coordination of metal ions, like the heme group which binds to iron. These prosthetic groups enhance the repertoire of the amino acids to provide additional functioning to the entire protein. Early coenzymes were described as being vital to normal functioning and were characterized as organic molecules with amine groups. Because of this coincidence, they were referred to as vitamins (for vital amines) though not all vitamins have amine groups. The trace metal ions that work with these groups are also required and represent the minerals on food items.
Genetic modification of organisms has been occurring through human manipulation since the beginning of agriculture. Humans selectively bred crops and livestock to propagate desirable traits in a process termed artificial selection. The original grass that gave rise to domesticated corn called teosinte hardly resembles what we think of when imagining modern maize.
Teosinte, the progenitor of maize. Corn came about due to selective breeding.
Variation: Crop domestication
Selective breeding can yield a variety of features even within the same species. Below is selection of vegetables of the species Brassica oleracea that have been developed into different varieties over the course of agricultural history.
Cabbage: Brassica oleracea var. capitataBroccoli: Brassica oleracea var. italicaKohlrabi: Brassica oleracea var. gongylodesRomanesco: Brassica oleracea var. botrytis
Variation: Animal domestication
Companion animals like dogs underwent thousands of years of domestication and selection for traits that were desirable for different circumstances. A high degree of morphological diversity exists between dog breeds and their ancestral grey wolf progenitor.
Genetic Manipulation (engineered)
Artificial selection takes multiple generations over a long period of time. With the advent of recombinant DNA and biotechnology, scientists can now genetically modify organisms through introduction of foreign genes to provide desirable characteristics within one generation. This process does not require traits to naturally arise in a species.
GloFish are transgenic zebra fish (Danio rerio) expressing variants of GFP. Bottom features a wild-type fish.GloFish® are novelty pets that have the insertion of various cnidarian fluorescent protein genes into the genome. These fish were released in the United States in 2003 and have subsequently been developed in red, orange, and blue varieties. Black tetras and tiger barbs are also now available.
Black tetra (Gymnocorymbus ternetzi) GloFishWild-type Black Tetra
Flow of information in cells. DNA serves as a template for copying itself (replication). DNA can also serve as a template for RNA (transcription). RNA is decoded into amino acids to generate proteins (translation).DNA was described as a molecule consisting of 2 anti-parallel strands in a double helix by Francis Crick and James Watson. The elegant model illustrated the intrinsic redundancy that made DNA a suitable data storage vessel for genetic information. Francis Crick later posited a notion of how this information went from storage to an actual program that runs cells. Crick first posited it as a “sequence hypothesis”. This idea of information flow is called the Central Dogma of Molecular Biology. DNA stores the information that is expressed as an intermediate message of RNA. This RNA is then translated in amino acids to yield proteins.
Transcription
DNA is simply a storage vessel of genetic information. It sits in the nucleus and must be called upon through a process of transcription where an enzyme called RNA Polymerase“reads aloud” the stored information into a molecule called messenger RNA (mRNA). Since DNA is double-stranded in an anti-parallel fashion, we automatically know the sequence of the second strand by knowing the first. The mRNA is made through complimentary base-pairing to the template strand, which is the reverse complement of the coding strand. The coding strand is the strand that reads identical in sequence to the mRNA with the exceptions of T’s being replaced by U’s.
Translation
This coding strand is later decoded by the ribosomes with the help of transfer RNA’s tRNA‘s) that act as a decoder of the information and protein assembler in a process called translation. The ribosome scans along the mRNA and recognizes nucleotides in batches of 3 . These batches of 3 can be translated into an amino acid and is known as a codon. Since there are 4 types of bases and they are read as groups of 3, there are 43 (or 64) combinations of these codons. However, there are only 20 amino acids used to build proteins. This indicates that there is room for redundancy. Three of these codons tell the ribosome to stop, like a period in a sentence. These are called stop codons. There is one special codon that performs double duty: ATG. The codon (ATG) that encodes the amino acid Methionine also acts as a start codon that tells the ribosome where to start reading from. Like nucleic acids, proteins have a polarity and are synthesized in an amino to carboxyl direction. We abbreviate this by terming the beginning of the protein sequence, N-terminal, and the ending of the sequence as the C-terminal.
Ribosomes are large complexes of enzymes that coordinate the decoding of mRNA into amino acids to generate proteins.
The standard genetic code.
Advanced video of Translation
Decisions… decisions…
What kinds of decisions are made for stem cells to differentiate into different cell types? What types of regulation occur during this process?
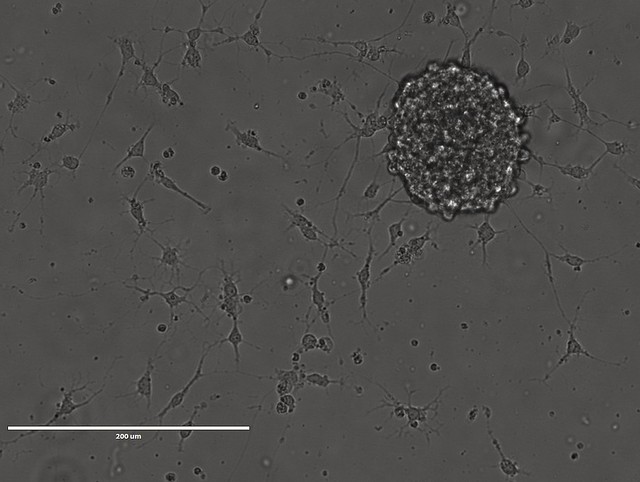
A cluster of neuronal progenitor cells (neurosphere) dissociates and differentiates into neurons.
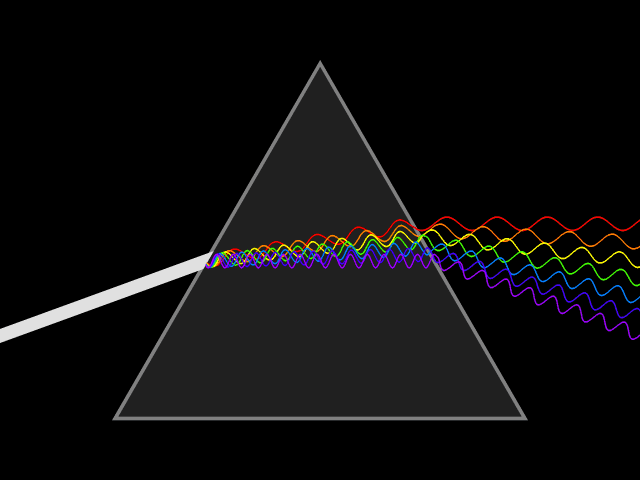
Light is a type of energy that travels as a wave-particle.The wavelength of light is the distances between peaks in the waves as light travels. Wavelengths are measured in nanometers (nm) and different wavelengths of light represent differing colors. White light is a mixture of the visible light spectrum. Light of long wavelengths (infra-red) and very short wavelengths (ultra violet) are invisible to humans but can be observed by other organisms. As wavelength decreases, the energy of the light is increased.
Diffraction of light through a prism exposes the components wavelengths of light.
Spectrophotometry
Spectrophotometers (spectro-image/color ; photo-light ; meter-measure) are used for chemical analysis of solutions based on properties of absorption or transmission.
Schematic of a spectrophotometer. The monochromator is a prism that splits the light. A single wave-length of light is focused through the aperture to pass through the solution in the cuvette.Transmittance refers to the amount of light that passes through the solution.
Transmittance of a light source through a cuvette. The intensity of light, I0, decreases as it passes through the solution. The light detected by the sensor, I, reflects the transmittance of the solution.
If light is being absorbed by chemicals in the solution, this results in a lower transmission. Absorbance is therefor inversely related to transmittance as expressed by the equation:
Beer’s Law is a relationship between the concentration or amount of a dissolved substance in a solution that is reducing the amount of transmitted light due to the absorption of the radiant energy. Lambert’s Law states that the reduction of transmittance was related to the length of the path of light. As the light path increases through a substance, there is a reduction in transmittance. Collectively, these ideas are referred to as Beer-Lambert Law, but most observers will control the path length and simply refer to it as Beer’s Law.
Some of our personal preferences arise from the way we were brought up. Culture plays a role in our likes and dislikes. Likewise, our experiences play a role in how we respond to certain stimuli. Another major factor that plays a role into our preferences comes wired in our genome. The DNA in our cells is the instruction manual for who we are. We are programmed to seek out things of a nutritive values in order to acquire raw materials like carbohydrates, proteins and lipids. In our search for nutritive compounds we have learned to avoid things that don’t taste good. Bitter things have a tendency to be associated with toxic compounds in nature. When eating a food item for the first time, molecules hit our tongue and stimulate multiple sensations: sweet, sour, salty, savory and bitter. Attributed to these multiple taste types are a diverse family of receptors that bind to the molecules that result in our perception of these sensations. Something bitter might make us learn to avoid this food item in the future. One type of bitter receptor senses the presence of a chemical called phenylthiocarbamide (PTC). This chemical chemically resembles toxic compounds found in plants but is non-toxic. The ability to taste PTC is comes from the gene called TAS2R38. This gene encodes a protein that on our tongues that communicates the bitterness of this chemical. There are two common alleles of this gene with at least five more uncommon variants. Within the two common forms, a single nucleotide polymorphism (SNP) is responsible for changing one amino acid in the receptor. It’s this difference of one amino acid that results in the ability of the receptor to either respond or not respond to PTC. We inherit one copy of the gene from our father and one copy from our mother. Based on how our parents gametes were formed and what alleles we received during the fertilization event determines how we respond to this chemical. Because we each have 2 copies of this gene, we can utilize simple Mendelian genetics to understand which allele is dominant or recessive.
Place a piece of “Control” paper on the tongue and indicate if there is a taste
Place a piece of “PTC” paper on the tongue and indicate if there is a taste and the taste severity
Fill out the table for the class to identify how many non-tasters, tasters or super-tasters there are.
Indicate if you believe the trait is dominant or recessive (ability to taste or not taste)
Assign a descriptor allele for the dominant (a capital letter) or the recessive (a lowercase letter) and draw a Punnet square for the F2 generation of 2 Heterozygous parents.
Compare the class tally of tasters and non-tasters in the class and discuss with your instructor if there is a clear dominance of this trait.
Table: PTC Tasting Tally
Questions:
How do you explain the presence of those who can’t taste PTC, those who can taste it and those who really can’t stand the taste of it?
This chemical is non-toxic and doesn’t exist in nature. Do you think there is a selective pressure that confers an advantage to those who do taste it?
In the mid 1800’s, an Augustinian friar named Gregor Mendel formalized quantitative observations on heredity in the the pea plant. He undertook hybridization experiments that utilized purebred or true breeding plants with specific qualities over many generations to observe the passage of these traits. Some of these physical traits included: seed shape, flower color, plant height and pod shape.
Pea flowersThe pea plant (Pisum sativum) offered a great advantage of being able to control the fertilization process and having large quantities of offspring in a short period of time. In a simple experiment of tracking the passage of a single trait (monohybrid cross) like flower color through multiple generations he was able to formulate rules of heredity. In this case, pea plants either produced white flowers or purple flowers for many generations (true breeding purple flower or true breeding white flower). These true breeding plants are referred to as the Parental Generation (P). By removing the male parts of the pea flower (anthers containing pollen), Mendel was able to control for self-pollination. The hybridization came from applying the pollen from one true breeding plant to the female part (the pistil) of the opposite true breeding plant. The subsequent offspring are referred to as the First Filial Generation (F1). In the first generation, all flowers are purple. Permitting self-pollination generates a Second Filial Generation (F2). This generation sees the re-emergence of the white flowered plants in an approximate ratio of 3 purple flowered to 1 white flowered plants.
Male and female parts of flowers. Mendel removed the anthers containing pollen to prohibit self-pollination and selectively applied the pollen to stigmas in order to control the “hybridization”.
The loss of one variant on the trait in the F1 plants with the re-emergence in the F2 prompted Mendel to propose that each individual contained 2 hereditary particles where each offspring would inherit 1 of these particles from each parent. Furthermore, the loss of one of the variants in the F1 was explained by one variant masking the other, as he explained as being dominant. The re-emergence of the masked variation , or recessive trait in the next generation was due to the both particles being of the masked variety. We now refer to these hereditary particles as genes and the variants of the traits as alleles.
Mendel’s Rules of Segregation and Dominance
The observations and conclusions that Mendel made from the monohybrid cross identified that inheritance of a single trait could be described as passage of genes (particles) from parents to offspring. Each individual normally contained two particles and these particles would separate during production of gametes. During sexual reproduction, each parent would contribute one of these particles to reconstitute offspring with 2 particles. In the modern language, we refer to the genetic make-up of the two “particles” (in this case, alleles) as the genotype and the physical manifestation of the traits as the phenotype. Therefore, Mendel’s first rues of inheritance are as follows:
Law of Segregation
During gamete formation, the alleles for each gene segregate from each other so that each gamete carries only one allele for each gene
Law of Dominance
An organism with at least one dominant allele will have the phenotype of the dominant allele.
The recessive phenotype will only appear when the genotype contains 2 recessive alleles. This is referred to as homozygous recessive
The dominant phenotype will occur when the genotype contains either 2 dominant alleles (homozygous dominant) or on dominant and one recessive (heterozygous)
The F1 cross (Punnett square) illustrating flower color inheritance in the F2The Punnett Square is a tool devised to make predictions about the probability of traits observed in the offspring in the F2 generation and illustrate the segregation during gamete formation.
The Single Trait Cross (Monohybrid Cross)
Monohybrid cross (one trait cross) observing the pod shape of peas.Monohybrid cross (on trait cross) observing the pod color of peas.
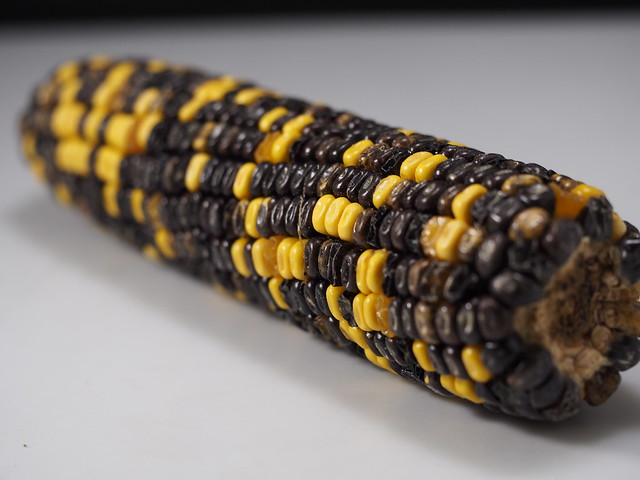
Corn Coloration in an F2 Population (activity)
A corn cob contains hundreds of kernels. Each kernel is a seed that represents an individual organism. In the cob, we can easily see kernel color as a phenotype.
Retrieve an F2 corn cob
Count a total of 100 kernels
Tally the number of Yellow Kernels within that 100 (in the dried state, anything yellow or honey colored counts as yellow)
Tally the number of Purple Kernels within that 100 (in the dried state, purple colored kernels may appear brown)
Ignore any speckled kernels that may have yellow and purple within them
Compare numbers with the class as a whole
From the numbers:
Is there a dominant color?
Which is dominant, if there is?
Create a Punnet square to illustrate the expected number of each color in a simple dominant:recessive paradigm.
The difference in nucleotide sequences between humans lies between 0.1-0.4%. That means that people are greater than 99% similar. But when you look around the room at your classmates, you can see that that small difference amounts to quite a bit of variation within our species. The bulk of these differences aren’t even within the coding sequences of genes, but lie outside in regulatory regions that change the expression of those genes. Imagine if there were mutations to the coding sequences, this could be very deleterious to the well-being of the organism. We say that the coding sequences of genes that ultimately lead to proteins has a selective pressureto remain the same. The areas outside of the coding sequences have a reduced and sometimes non-existent selection pressure. These areas are allowed to mutate in sequence and even expand or contract. Areas of changes or differences are called polymorphic(many forms). If you were to read a repetitive set of sequences and count the repetition, you’d make mistakes and lose count. Likewise, DNA
polymerase will make errors or stutter in areas of repetitiveness and produce polymorphic regions.
Tandem Repeats
A type of polymorphism occurs due to these repeats expanding and contracting in non-coding regions. These regions are called variable number tandem repeats (VNTRs)
or sometimes short tandem repeats (STRs). Any region or location on a chromosome is referred to as locus(loci for plural). Scientists use polymorphic loci that are known to
contain VNTRs/STRs in order to differentiate people based on their DNA. This is often used in forensic science or in maternity/paternity cases. Any variation of a locus is referred to as an allele. In standard genetics, we often think of an allele as a variation of gene that would result in a difference in a physical manifestation of that gene. In the case of STRs, these alleles are simply a difference in number of repeats. That means the length of DNA within this locus is either longer or shorter and gives rise to many different alleles. VNTRs are referred to as minisatellites while STRs are called microsatellites.
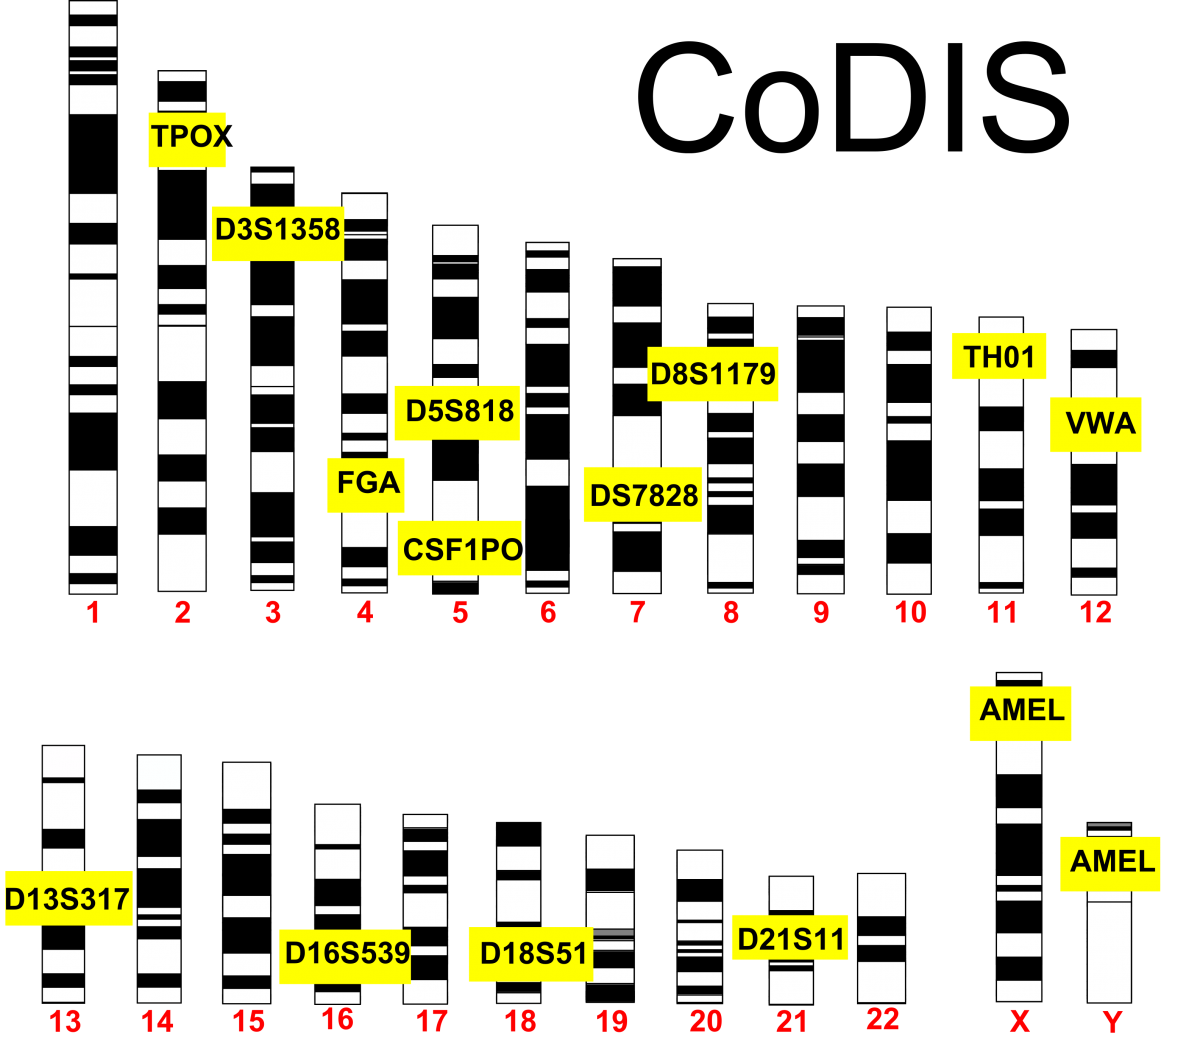
CoDIS
The FBI and local law enforcement agencies have developed a database called the Combined DNA Index System (CoDIS) that gathers data on a number of STRs. By establishing the number of repeats of a given locus, law enforcement officials can differentiate individuals based on the repeat length of these alleles. CoDIS uses a
set of 13 loci that are tested together. As you would imagine, people are bound to have the same alleles of certain loci, especially if they were related. The use of 13 different loci makes it statistically improbable that 2 different people could be confused for each other. Think about this in terms of physical traits. As you increase the number of physical traits used to describe someone, you are less likely to confuse that person with someone else based on those combinations of traits. Using the CoDIS loci increases the stringency since there are many alleles for each locus. The thirteenth locus in CoDIS (called AMEL) discriminates between male and female.
CoDIS STRs: The FBI utilizes 13 different loci to discriminate between people. AMEL discriminates by gender and is located on the X & Y.
Crime Scene Investigation
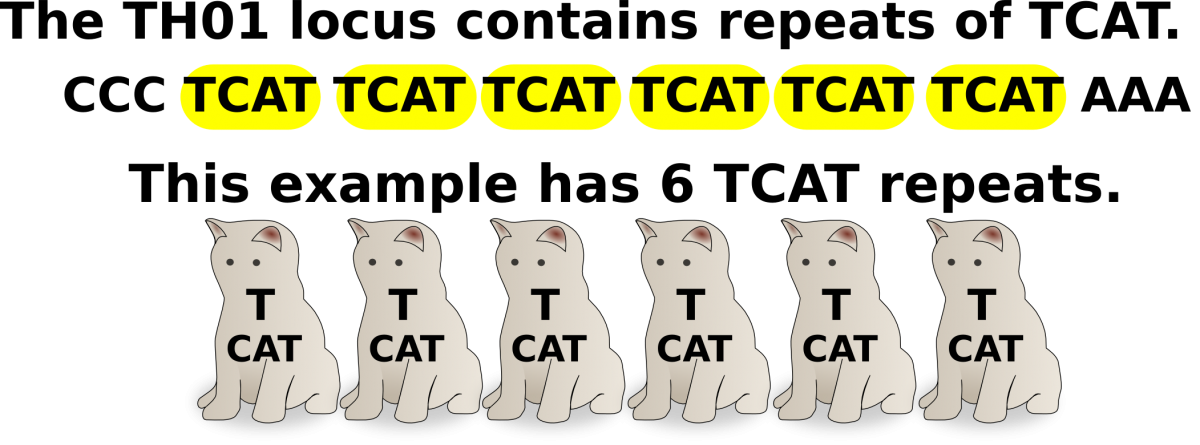
This lab uses a CoDIS locus called TH01. TH01 is a locus on chromosome 11 that has a repeating sequence of TCAT. There are reported to be between 3-14 repeats in this locus. With the exception of X and Y in a male, all chromosomes have a homologous partner. Therefore, each individual will have 2 alleles for each CoDIS locus.
TH01 STR: Outside of the STR, there is flanking areas of known sequence. The primers that amplify TH01 in PCR recognize these flanking sequences to amplify the TCAT repeats.
At a crime scene, criminals don’t often leave massive amounts of tissue behind. Scant evidence in the form of a few cells found within bodily fluids or stray hairs can be enough to use as DNA evidence. DNA is extracted from these few cells and amplified by PCR using the specific primers that flank the STRs used in CoDIS.
DNA evidence from a crime scene: DNA can be extracted from cells found from various sources at a crime scene. PCR can amplify this small amount of DNA.
Amplified DNA will be separated by gel electrophoresis and analyzed. Size reference standards and samples from the crime scene and the putative suspects would be analyzed together. In a paternity test, samples from the mother, the child and the suspected father would be analyzed in the same manner. A simple cheek swab will supply enough cells for
this test.
TH01 locus used in a Paternity/Maternity test: Individual PCR reactions are run for each sample (mom, dad, child). The TH01 primer pair specifically amplifies the locus. Each amplified sample is run on the same gel to resolve the different alleles of TH01 from each individual. From this test the sample could be the offspring from these 2 parents but use of more STRs would make it more definitive. Count the TCATs.

 Bacteria or other cells can be engineered to express proteins through the process of cloning and transformation. Bacteria are advantageous because of their rapid life cycle and ease of growth. A bacterial expression vector contains the basic plasmid features: origin of replication as well as antibiotic resistance gene. Often, an affinity tag will be used to aid in purification of the protein. An example in the vector above shows the GST (glutathione-s-transferase) tag that can be purified with glutathione resin. Expression is only the first problem since bacteria are also synthesizing proteins that are required for the bacteria to grow and divide. Injecting these proteins in addition to insulin would cause an immune reaction that could be deadly. Therefore, it is required that overexpressed proteins be purified and isolated from other undesirable proteins.
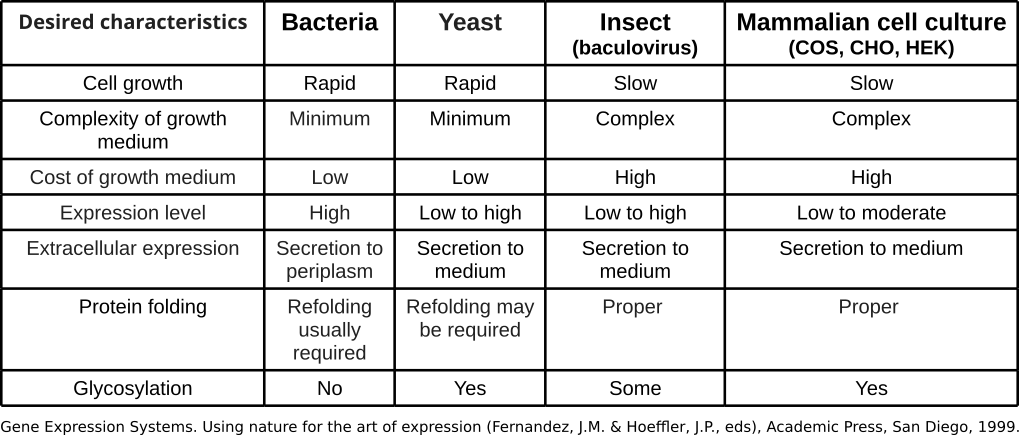


 The process used to trap these small particles is called size exclusion. Unlike agarose gel electrophoresis where the smaller particles navigate through the matrix faster, size exclusion resins trap the smaller molecules.

.jpg)

") and
and ")

 .
.
 and
and 

 = \sqrt{\sum_{k=1}^{p}(X_{ik} - X_{jk})^2}\")

 [GFDL (http://www.gnu.org/copyleft/fdl.html) or CC-BY-SA-3.0 (http://creativecommons.org/licenses/by-sa/3.0/)], via Wikimedia Commons")