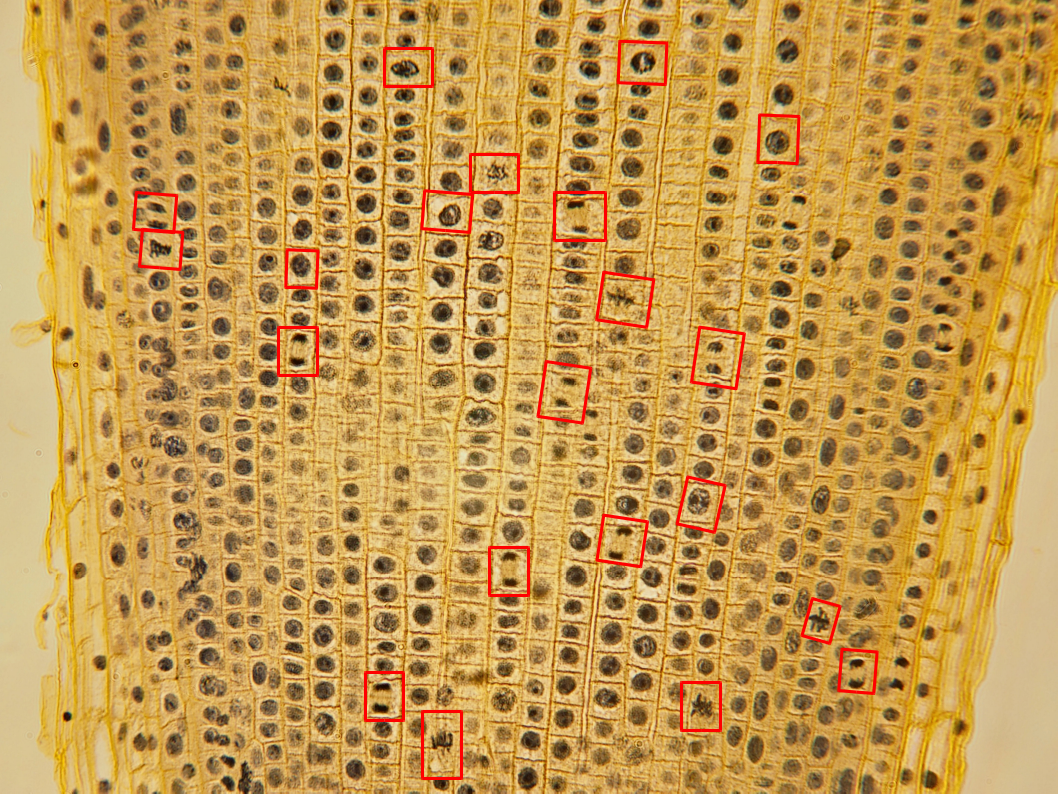
Activity: Estimating the Time Spent in the Phases of Mitosis
Cells in your body reproduce at different rates. Skin cells reproduce frequently (about once per day); liver cells reproduce rarely (about once per year). Some specialized cells like nerve and muscle cells almost never reproduce and are in a special stage called G0. The whole process of mitosis, prophase to telophase, takes approximately 90 min. In plants, an area of rapid growth is the tips of roots. This exercise uses onion root tips to illustrate the amount of time spent in each phase of mitosis.
Work as a team to look at onion root tips under the microscope. This area of the root is undergoing rapid cell reproduction.
Identify the phases of the cell cycle for 25 randomly chosen cells. Record this information in the table.
Trade results with 3 other people
In an onion root tip, the entire cell cycle takes about 12 hours or 720 minutes
Calculate the percentage of time spent in each phase by counting the total number of cells in each phase (total in interphase, in prophase, etc.) and dividing each by the total number of cells you counted.
Multiply the percentage of time in each phase by the total time of the cell cycle (720 minutes) and this gives you an estimate of the time spent in each phase.
Number of Cells in each phase
Interphase
Prophase
Metaphase
Anaphase
Telophase
Total
You (25)
Partner 1 (25)
Partner 2 (25)
Partner 3 (25)
Totals
Estimate of time spent in each phase of the cell cycle
Experimental science looks at cause and effect types of relationships. Controlled experiments vary one of the factors or traits to observe the effect on another factor or trait. These factors are called variables. A dependent variable is something that is observed and expected to change as a result of modifying another factor in the experiment. That is to say, the outcome depends on another factor. Another name for dependent variable is responding variable. The independent variable is the factor or condition that is changing or being changed by the experimenter. Sometimes waiting is the the condition that is changing, making the independent variable : time. Since we change the independent variable, it is also called the manipulated variable.
Graphing a line
A graph displaying 2 lines and their equations
A line can be described mathematically by the equation:
This is referred to as the slope-intercept form. The 2 variables y and x refer to coordinates along each axis. The term m refers to the change in the y-values over the change in the x-values. This is referred to as the slope of the line. The term b, the y-intercept, is the y-value where the line crosses the y-axis.
OR
This is how the slope of a line (m) is determined.
The slope of the line indicates the relationship between the two variables, x and y. The equation of the line indicates to us that “y” occurs as a function of changes to “x”. Sometimes this is represented by the equation . Since “y” depends on “x”, “y is the dependent variable and “x” is the independent variable. As “x” changes, how does “y” change in response? This is what the slope reveals to us.
What does this scatterplot tell us about the relationship between consumption of mozzarella in relationship to years?
How would this graph influence the way you invest in a mozzarella cheese company? Can you predict anything about the future of cheese consumption?
What does the slope of this line indicate to you?
Use mathematics to illustrate this point.
The slope has a unit related to “lbs.” and “year”, what is this unit?
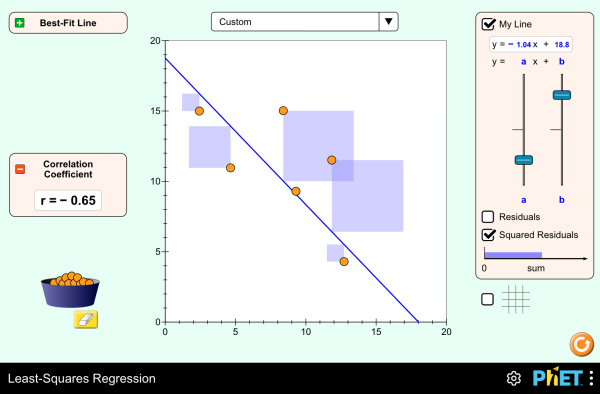
Creating a Line of Best Fit
Not all points collected will fall on a straight line. A Line of Best Fit or a Trendline approximates the average of those points through a mathematical process called the least squares method. While one could “eyeball” this line, the least squares method uses the data to minimize the distance from all those points to the line to have an averaging effect.
Create a column of data for “x” values, “y” values, x2 and xy
At the bottom of these columns, sum the data. Σx, Σy, Σx2, Σxy
In the mid 1800’s, an Augustinian friar named Gregor Mendel formalized quantitative observations on heredity in the the pea plant. He undertook hybridization experiments that utilized purebred or true breeding plants with specific qualities over many generations to observe the passage of these traits. Some of these physical traits included: seed shape, flower color, plant height and pod shape.
Pea flowersThe pea plant (Pisum sativum) offered a great advantage of being able to control the fertilization process and having large quantities of offspring in a short period of time. In a simple experiment of tracking the passage of a single trait (monohybrid cross) like flower color through multiple generations he was able to formulate rules of heredity. In this case, pea plants either produced white flowers or purple flowers for many generations (true breeding purple flower or true breeding white flower). These true breeding plants are referred to as the Parental Generation (P). By removing the male parts of the pea flower (anthers containing pollen), Mendel was able to control for self-pollination. The hybridization came from applying the pollen from one true breeding plant to the female part (the pistil) of the opposite true breeding plant. The subsequent offspring are referred to as the First Filial Generation (F1). In the first generation, all flowers are purple. Permitting self-pollination generates a Second Filial Generation (F2). This generation sees the re-emergence of the white flowered plants in an approximate ratio of 3 purple flowered to 1 white flowered plants.
Male and female parts of flowers. Mendel removed the anthers containing pollen to prohibit self-pollination and selectively applied the pollen to stigmas in order to control the “hybridization”.
The loss of one variant on the trait in the F1 plants with the re-emergence in the F2 prompted Mendel to propose that each individual contained 2 hereditary particles where each offspring would inherit 1 of these particles from each parent. Furthermore, the loss of one of the variants in the F1 was explained by one variant masking the other, as he explained as being dominant. The re-emergence of the masked variation , or recessive trait in the next generation was due to the both particles being of the masked variety. We now refer to these hereditary particles as genes and the variants of the traits as alleles.
Mendel’s Rules of Segregation and Dominance
The observations and conclusions that Mendel made from the monohybrid cross identified that inheritance of a single trait could be described as passage of genes (particles) from parents to offspring. Each individual normally contained two particles and these particles would separate during production of gametes. During sexual reproduction, each parent would contribute one of these particles to reconstitute offspring with 2 particles. In the modern language, we refer to the genetic make-up of the two “particles” (in this case, alleles) as the genotype and the physical manifestation of the traits as the phenotype. Therefore, Mendel’s first rues of inheritance are as follows:
Law of Segregation
During gamete formation, the alleles for each gene segregate from each other so that each gamete carries only one allele for each gene
Law of Dominance
An organism with at least one dominant allele will have the phenotype of the dominant allele.
The recessive phenotype will only appear when the genotype contains 2 recessive alleles. This is referred to as homozygous recessive
The dominant phenotype will occur when the genotype contains either 2 dominant alleles (homozygous dominant) or on dominant and one recessive (heterozygous)
The F1 cross (Punnett square) illustrating flower color inheritance in the F2The Punnett Square is a tool devised to make predictions about the probability of traits observed in the offspring in the F2 generation and illustrate the segregation during gamete formation.
The Single Trait Cross (Monohybrid Cross)
Monohybrid cross (one trait cross) observing the pod shape of peas.Monohybrid cross (on trait cross) observing the pod color of peas.
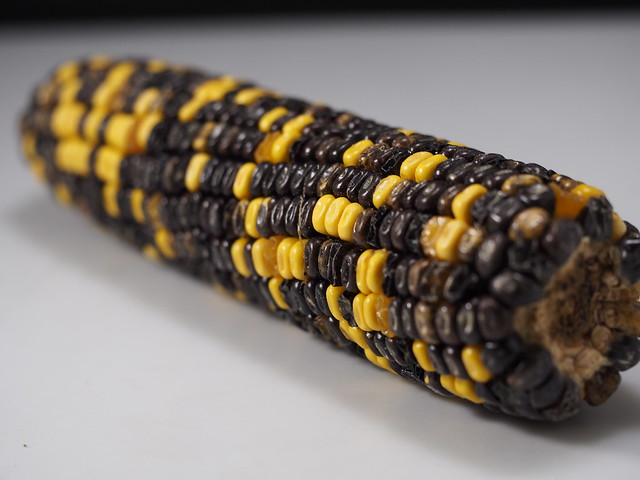
Corn Coloration in an F2 Population (activity)
A corn cob contains hundreds of kernels. Each kernel is a seed that represents an individual organism. In the cob, we can easily see kernel color as a phenotype.
Retrieve an F2 corn cob
Count a total of 100 kernels
Tally the number of Yellow Kernels within that 100 (in the dried state, anything yellow or honey colored counts as yellow)
Tally the number of Purple Kernels within that 100 (in the dried state, purple colored kernels may appear brown)
Ignore any speckled kernels that may have yellow and purple within them
Compare numbers with the class as a whole
From the numbers:
Is there a dominant color?
Which is dominant, if there is?
Create a Punnet square to illustrate the expected number of each color in a simple dominant:recessive paradigm.
Take 3 blocks of agar of different size (1cm, 2cm, 3cm) → these are our cell models
Measure the length, width and height of each cube using a ruler
Calculate the area of each face of the cubes and add all the areas together for a single cube
a cube has 6 faces → the total surface area is the same as the area of one side multiplied by 6
Calculate the volume of each cube
Report the surface area-to-volume in the table below
Data Table: Calculating Surface Area-to-Volume Ratio
Cell Model (cube)
Length
Width
Height
Total Surface Area
Volume of cell
Surface Area: Volume
1
2
3
Stop and think:
Which cube has the greatest surface area:volume ratio?
Which cube has the smallest surface area:volume ratio?
Hypothesize: In an osmosis or diffusion experiment, which cube size would have the greatest diffusion rate?
Procedures:
Each group will acquire three agar cubes: A 3cm cube, a 2cm cube, and a 1cm cube. CUT AS ACCURATELY AS POSSIBLE . (This may be already completed for you.)
Place cubes into a beaker and submerge with 200 ml NaOH
Let the cubes soak for approximately 10 minutes.
Periodically, gently stir the solution, or turn the cubes over.
After 10 minutes, remove the NaOH solution
Blot the cubes with a paper towel.
Promptly cut each cube in half and measure the depth to which the pink color has penetrated. Sketch each block’s cross-section.
Record the volume that has remained white in color.
Do the following calculations for each cube and complete the following data table:
Data Table: Calculation of Diffusion Area-to-Volume
Cube
Size
Cube
volume (cm3)
Vtotal
Volume
white
(cm3)
Vwhite
Sketch
cross-section of each
Cube
Volume
of the diffused cube
(Vtotal – Vwhite)
Vdiffused
Percent
Diffusion (Vdiffused/Vtotal)
% Diffused
Surface
Area: Volume
(from
previous table)
1cm
2cm
3cm
Conclude:
Which cube had the greatest percentage of diffusion?
Did this meet your expectations with your hypothesis?
If you designed a large cell, would it be a large sphere or something long and flat?
The difference in nucleotide sequences between humans lies between 0.1-0.4%. That means that people are greater than 99% similar. But when you look around the room at your classmates, you can see that that small difference amounts to quite a bit of variation within our species. The bulk of these differences aren’t even within the coding sequences of genes, but lie outside in regulatory regions that change the expression of those genes. Imagine if there were mutations to the coding sequences, this could be very deleterious to the well-being of the organism. We say that the coding sequences of genes that ultimately lead to proteins has a selective pressureto remain the same. The areas outside of the coding sequences have a reduced and sometimes non-existent selection pressure. These areas are allowed to mutate in sequence and even expand or contract. Areas of changes or differences are called polymorphic(many forms). If you were to read a repetitive set of sequences and count the repetition, you’d make mistakes and lose count. Likewise, DNA polymerase will make errors or stutter in areas of repetitiveness and produce polymorphic regions.
Tandem Repeats
A type of polymorphism occurs due to these repeats expanding and contracting in non-coding regions. These regions are called variable number tandem repeats (VNTRs) or sometimes short tandem repeats (STRs). Any region or location on a chromosome is referred to as locus(loci for plural). Scientists use polymorphic loci that are known to contain VNTRs/STRs in order to differentiate people based on their DNA. This is often used in forensic science or in maternity/paternity cases. Any variation of a locus is referred to as an allele. In standard genetics, we often think of an allele as a variation of gene that would result in a difference in a physical manifestation of that gene. In the case of STRs, these alleles are simply a difference in number of repeats. That means the length of DNA within this locus is either longer or shorter and gives rise to many different alleles. VNTRs are referred to as minisatellites while STRs are called microsatellites.
CoDIS
DNA fingerprinting. Credit: Helixitta,The Photographer and Jeremy Seto (CC-BY-SA 3.0)The FBI and local law enforcement agencies have developed a database called the Combined DNA Index System (CoDIS) that gathers data on a number of STRs. By establishing the number of repeats of a given locus, law enforcement officials can differentiate individuals based on the repeat length of these alleles. CoDIS uses a
set of 20 loci that are tested together. As you would imagine, people are bound to have the same alleles of certain loci, especially if they were related. The use of 20 different loci makes it statistically improbable that 2 different people could be confused for each other. Think about this in terms of physical traits. As you increase the number of physical traits used to describe someone, you are less likely to confuse that person with someone else based on those combinations of traits. Using the CoDIS loci increases the stringency since there are many alleles for each locus. The twentieth locus in CoDIS (called AMEL) discriminates between male and female.
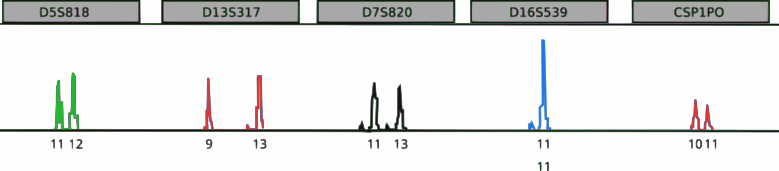
CoDIS STRs: The FBI utilizes 20 different loci to discriminate between people. AMEL discriminates by gender and is located on the X & Y. Credit: Jeremy Seto (CC-BY-NC-SA) STR electropherogram of a three person mixtureA genotype of 5 STR markers. Peaks illustrate the signal detected and the intensity of the signal corresponding to repeat sizes. The peak height of D16S539 is twice the size of other peaks and illustrates that this locus contains two of the same repeat sizes.
Crime Scene Investigation
This lab uses a CoDIS locus called TH01. TH01 is a locus on chromosome 11 that has a repeating sequence of TCAT. There are reported to be between 3-14 repeats in this locus. With the exception of X and Y in a male, all chromosomes have a homologous partner. Therefore, each individual will have 2 alleles for each CoDIS locus.
TH01 STR: Outside of the STR, there is flanking areas of known sequence. The primers that amplify TH01 in PCR recognize these flanking sequences to amplify the TCAT repeats. Credit: Jeremy Seto (CC-BY-NC-SA)
At a crime scene, criminals don’t often leave massive amounts of tissue behind. Scant evidence in the form of a few cells found within bodily fluids or stray hairs can be enough to use as DNA evidence. DNA is extracted from these few cells and amplified by PCR using the specific primers that flank the STRs used in CoDIS.
DNA evidence from a crime scene: DNA can be extracted from cells found from various sources at a crime scene. PCR can amplify this small amount of DNA. Credit: Jeremy Seto (CC-BY-NC-SA)
Amplified DNA will be separated by gel electrophoresis and analyzed. Size reference standards and samples from the crime scene and the putative suspects would be analyzed together. In a paternity test, samples from the mother, the child and the suspected father would be analyzed in the same manner. A simple cheek swab will supply enough cells for
this test.
TH01 locus used in a Paternity/Maternity test: Individual PCR reactions are run for each sample (mom, dad, child). The TH01 primer pair specifically amplifies the locus. Each amplified sample is run on the same gel to resolve the different alleles of TH01 from each individual. From this test the sample could be the offspring from these 2 parents but use of more STRs would make it more definitive. Count the TCATs. Credit: Jeremy Seto (CC-BY-NC-SA)
Agarose is a linear carbohydrate polymer purified from the cell walls of certain species of algae. Agar is a combination of the crude extract that contains agarose and the smaller polysaccharide agaropectin. When dissolved and melted in liquid, agarose strands become tangled together to form a netting that holds the fluid in a gel. Reduction of the fluid creates a higher percentage gel that is firmer and contains smaller pores within the netting.
Placing a comb within the melted agarose creates spaces that allow for the insertion of samples when the gel is solidified. Molecules can traverse through the pores as they are drawn by electrical currents. Charged compounds will migrate towards the electrode of opposite charge but migration rate will be influenced by the size of the molecules. Smaller compounds can easily traverse through the webbing while larger items are retarded by the pore size. Follow this simulation to get a better idea of how we use Agarose Gel Electrophoresis in molecular biology to study DNA fragments.
DNA molecules are not readily visible when resolved (separated) on an agarose gel. In order to visualize the molecules, a DNA dye must be administered to the gel. In research labs, a DNA intercalating agent called Ethidium Bromide is added to the molten gel and will bind to the DNA of the samples when run. Ethidium Bromide can then be visualized on a UV box that will fluoresce the compound and reveal bands where DNA is accumulated. Since Ethidium Bromide is known as a carcinogen, teaching labs will use a safer DNA intercalating agent known as Sybr Green. This can be visualized in a similar fashion, but will fluoresce a green color instead.
Agarose gels visualized on a UV transilluminator. Left shows a gel with Ethidium bromide. Right shows a gel with Sybr Green.
Agarose gels are made of and bathed in a buffered solution, usually of Tris-Borate-EDTA (TBE) or Tris-Acetate-EDTA (TAE). Regardless of buffer solution, the buffer provides necessary electrolytes for the current to pass through and maintain the pH of the solution.
DNA samples are prepared in a buffer similar to the solution that it will be run in to ensure that the phosphate backbone of the DNA remains deprotonated and moves to the positive electrode. Additionally, glycerol or another compound is added to this buffer in order for the solution to sink into the wells without spreading out. A dye is often included in this loading buffer in order to visualize the loading in the wells and to track the relative progression of gel.
We’re all familiar with gelatin (like the Jello brand). Gummy candies are are made of gelatin. Gelatin is a protein that exists as long fibers. When gelatin is dissolved in a liquid and cooled, the gelatin fibers tangle together in a mesh-like network. The space in between the gelatin molecules is filled with the fluid it was dissolved in. Gummy candies are considerably more firm than the gelatin molds we have as desserts because they contain a lot less fluid. Nonetheless, gummy candies are filled with a sugary solution with coloring. Like a cell, a gummy candy placed in solution will be affected by the properties of osmosis when submerged in different solutions.
Stop and think
Is distilled water hypertonic, hypotonic or isotonic compared to the sugar solution inside a gummy candy?
Based on your answer, hypothesize if a gummy candy submerged in distilled water or 40% salt solution will swell faster? Label the diagram below with your hypothesis.
Procedures
Obtain 2 gummy bears and place them in 2 different small flasks.
Drown 1 bear in distilled water and drown the other in 40% salt solution.
At the end of the lab session, remove the bears from solution and document the size difference with your mobile phone.
Hypothesized swelling of the bear based on tonicity
Agar is a gelatinous substance derived from a structural carbohydrate found in seaweed. It is often used in cooking as a vegetarian alternative to gelatin and can be used as a thickener. Microbiologists pour plates of agar containing nutrients in order to isolate and grow bacteria and other microbes. As with gelatin, the long fibery nature of this structural carbohydrate permits it to be melted and tangled together in a mesh-like network where the spaces between molecules are filled with solution. Altering the amount of fluid solution will change the pores between fibers. More fluid will create a looser gel that has larger spaces between molecules. Reducing the fluid solution volume will conversely create a stiffer gel with smaller spaces between fibers.
Take 2 tubes of agar and a solution of Malachite green (365 g/mole) and a solution of Potassium permanganate (164 g/mole)
Mark the top of the agar on the outside of the tube (the starting point)
Add 10 drops of malachite green to one tube and 10 drops of Potassium permanganate to the other
Take note of the time
At 20 minute intervals, measure the distance from the top that the agar has moved. Do this for at least 1 hour.
Plot the data and compare the trends. Describe the rate of diffusion for each.
Stop and Think:
Hypothesize which solution will move faster through the agar and provide a reason.
Hypothesize
which solution will move faster through the agar and provide a
reason.
Illustration of Hooke’s microscopeIn 1665, Robert Hooke published Micrographia, a book that illustrated highly magnified items that included insects and plants. This book spurred on interest in the sciences to examine the microscopic world using lenses but is also notable for Hooke’s observations of cork where he used the word “cell” in a biological sense for the first time.
The empty chambers of cork inspired Hooke to coin the term “Cell”
The father of Microbiology: van Leeuwenhoek
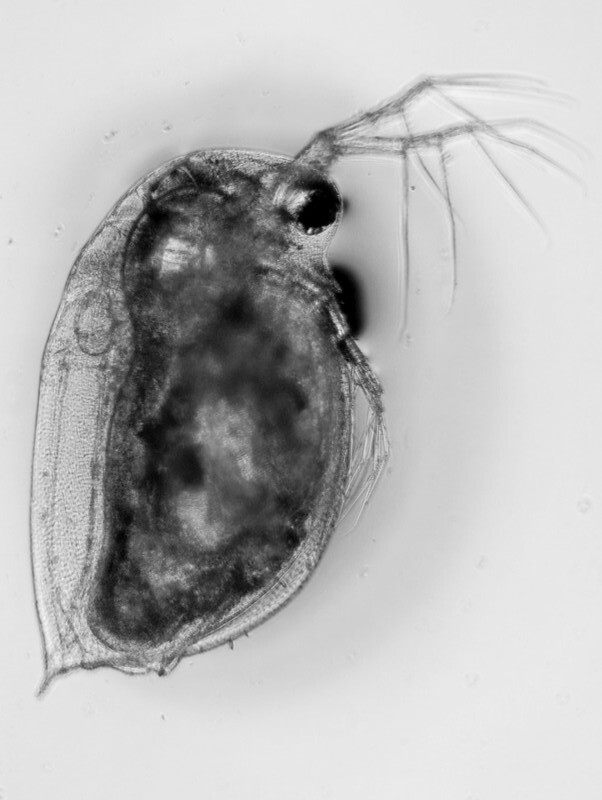
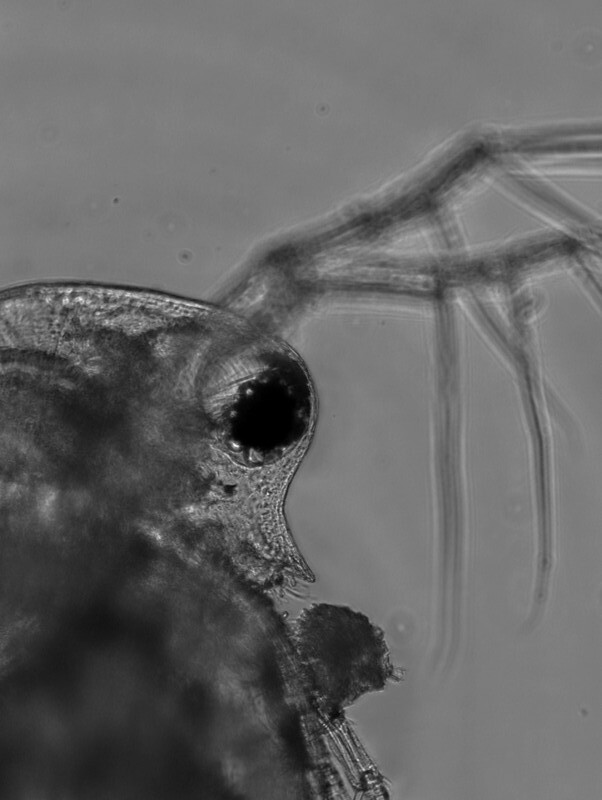
van Leeuwenhoek’s microscopeThe Dutch tradesman Antonie van Leeuwenhoek used high power magnifying lenses to examine the parts of insects and to examine the quality of fabric in his drapery business. He began to experiment with pulling glass to generate lenses and developed a simple microscope to observe samples. Using a simple single lens with a specimen mounted on a point, he was able to identify the first microscopic “animalcules” (little animals) that will be later known as protozoa (original animals).
Though van Leeuwenhoek’s apparatus was simple, the magnifying power of his lenses and his curiosity enabled him to perform great scientific observations on the the microscopic world. He was ridiculed for fabricating his observations of protists at first. Ever the scientist, van Leeuwenhoek examined samples of his own diarrhea to discover Giardia intestinalis. While he did not make the connection of the causative nature of this microorganism, he described the details of the way this organism could propel itself through the medium in great detail.
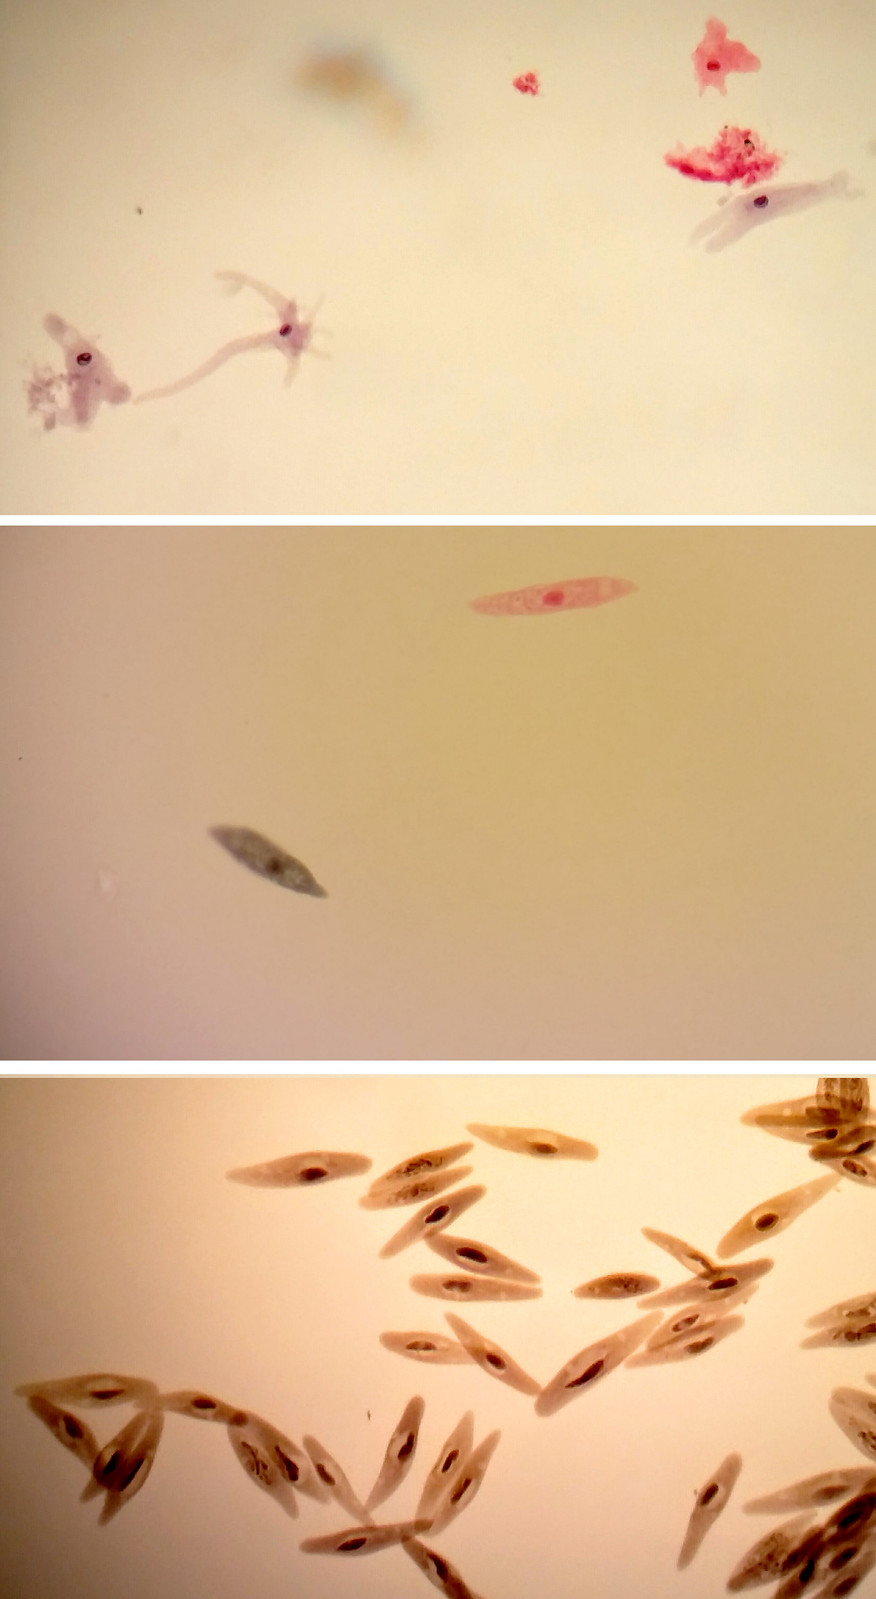
Modern micrograph of Giardia intestinalis (Kingdom Protista)
Modern Compound Microscope
Unlike van Leeuwenhoek’s single lens microscope, we now combine the magnifying power of multiple lenses in what is called a compound microscope.


 OR
OR 
= mx + b") . Since “y” depends on “x”, “y is the dependent variable and “x” is the independent variable. As “x” changes, how does “y” change in response? This is what the slope reveals to us.
. Since “y” depends on “x”, “y is the dependent variable and “x” is the independent variable. As “x” changes, how does “y” change in response? This is what the slope reveals to us.
- \Sigma x \Sigma y}{N (\Sigma x^2)-(\Sigma x)^2}") (where N=number of entries in a column)
(where N=number of entries in a column) - m (\Sigma x)}{N}")


.jpg)


.jpg)