Contents
Dilute BSA Standards
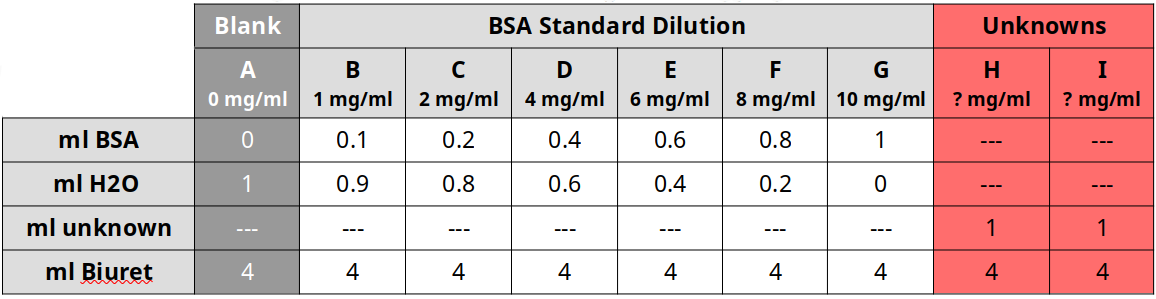
- Label 9 tubes 1-9
- Combine the components of the table below to generate appropriate concentration of solutions
- Place tube 1 (blank) into a cuvette and measure absorbance (A) in the spectrophotometer at 540 nm
- Calibrate the spectrophotometer to read 0 at A540nm
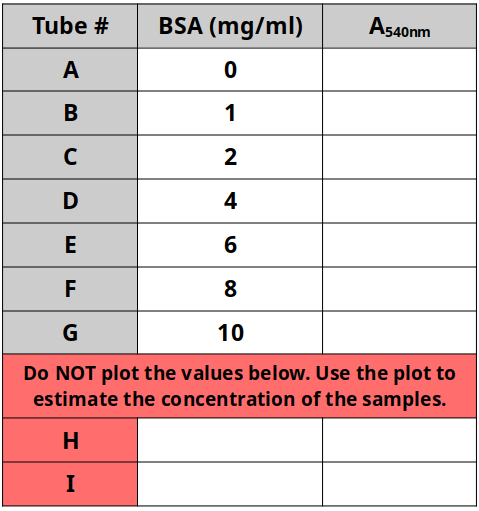
- Sequentially read each sample at A540nm and record values in table below
- Plot each BSA dilution in a spreadsheet program like Excel as a scatterplot
- Generate best-fit line for these standards with the equation of the line
- Use the equation of the line to estimate the concentration of the unknown sample.
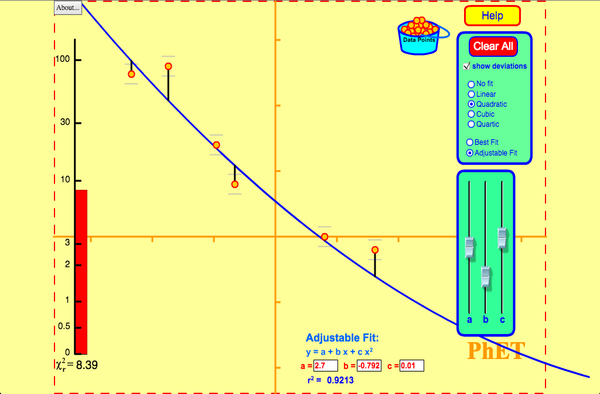
Curve Fitting
Run the simulation below to understand how you can use the standard dilution series to estimate your sample concentrations.
Scatterplot Tutorial
Use the tutorial below and watch at 1.25X to plot your own data.
Tags: quantitative reasoning

