Contents
Discovering Buffers
- Take a small beaker of distilled water and determine its pH. Add one drop of strong acid or of strong base to the water and observe the pH reading on the meter.
- Now take a small sample of either the standard pH buffer or of any other buffer solution in the lab and add a drop of either strong acid or strong base. Does the reading on the pH meter remain constant or does it change rapidly as it did with the distilled water?
Titration of Acetic Acid
Use the following situation to mimic the set-up below: https://iwant2study.org/lookangejss/chemistry/WASB.html

- Place 50 ml of 0.1M acetic acid into a 250ml beaker
- Add 5 drops of phenolphthalein indicator and swirl briefly
- Determine the initial pH with probe
- Fill a buret with 0.1 N NaOH
- Add 3 ml volumes NaOH and swirl flask briefly
- Record the pH and observe the color of the solution
- Continue to add increments of 3 ml (with swirling) and record the pH until the pH reaches 10.
- Using a computer, plot pH readings on the y-axis and the volume of base on the x-axis. You can try to use Plot.ly

Scatterplot Tutorial
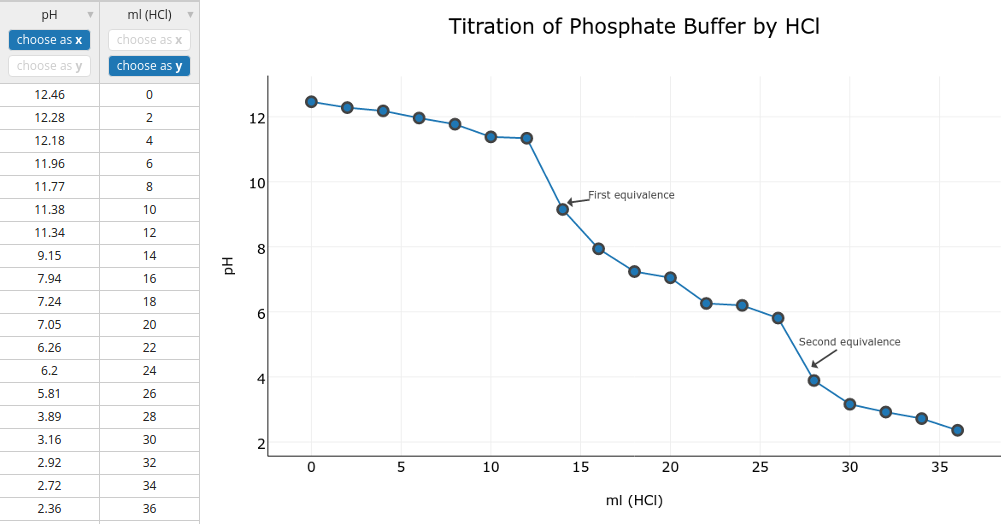
Download the data to try in Plot.ly Follow this tutorial on using Plot.ly to generate a graph. However, do not draw a trendline.
Tags: quantitative reasoning

