Study Guide for Problem #10

America Hernandez

Problem #10

According to the NIH, 32% of all women will fracture their hip by age 90. If 8 women age 90 are selected at random, what is the probability that exactly 5 of them will have suffered a hip fracture?

  • Step 1: begin by turning 32% into .32, This will be your success which is our (P).
  • Step 2: next we need to find the failure number , so you have to subtract 1 – .32 = .68 this will be our (q)
  • Step 3: Since 8 women are selected at random, this value will be our (n) or sample group
  • Step 4: Since the question is asking exactly 5 out of the 8 will have suffered a hip fracture, 5 will be our (x)
  • Step5: now that we have all our values we have to check to see if  n*p and n*q are greater than (>) 5 (this is a very important step and it must always be done for this type of problem to insure that you end up using the correct formula). So it will look like this np= 8 * .32= 2.56  nq=8 * .68= 5.44  **NOTE** since one of our values is not greater than 5 (np=2.56) we have to use the binomial distribution equation: nCx * p^x * q^n-x 
  • Step 6: Now plug these values into the equation like so: n=8 , p= .32, q=.68, x=5               8C5 ( .32 )^5 ( .68 ) ^8-5 =                                                                                               56    ( .32 )^5 ( .68 ) ^3 = .059 

Hope my explanation was helpful and good luck on the final EVERYONE !!!! 🙂                                                              


STUDY GUIDE FOR PROBLEM # 15

STUDY GUIDE FOR PROBLEM # 15

By Anthony Marc


15) It is claimed that the average annual per person spending on prescription drugs is $410. If a survey of 65 randomly selected people indicated an average spending of $425 with a standard deviation of $45, do we reject the claim that the average is $410? Use a 5% level of significance.

  • The first thing to do is construct a hypothesis test with a null and alternative hypothesis to test whether the claim will be greater, less than or equal to the average of what is already stated. The tails of the test refer to the area in the normal curve which corresponds to the alternative hypothesis (the region where we you reject the null hypothesis). The claim states that the average per person annually spending on prescription drugs is $410.
  • Ho (The null hypothesis) would be that the average spent would be equal to $410 and Ha (the alternative hypothesis) would also not be equal to $410. Both hypotheses are considered not equal due to the fact that average is NOT more or less than $410 but is exactly that number $410 being spent.
  • It’s a two tailed test
  • The level of significance is the amount on the normal curve whose maximum probability determines whether or not to reject the claim from the mean to the rejection area.
  • The level of significance is 5% which comes out to 5/100= .0500. Since the normal distribution curve is two tailed the level of significance has to be divided by two to determine the rejection area.
  • .0500/2= .0250 for both ends of the curve. Looking on the table the critical value comes out to z = -1.96.


  SOLUTION:

  • The problem would be done as: ,  Z= 425-410/45 and the square root of 65
  • What made it easier for me to solve this problem was do it step by step starting off with the square root of n= 65, which comes out to 8.062257748.
  • Then divide that sum by the standard deviation of 45, so you would divide 45/8.062257748 which comes to the answer of 5.581563057.
  • Then subtract the average by the sample mean (425-410) and divide (5.581563057) which come to the answer of Z= 2.687419249.
  • So as a result we REJECT the claim.

The claim is rejected due to the fact that the Z score is higher than the critical value which determines whether or not it falls within the range of values whether the claim is acceptable. So people annually spend more than the average $410 per year on prescription drugs.


Updated Final Exam Review Sheet

Early this morning I received an email from the Math Department with an updated Final Exam Review Sheet for MAT 1272.  The good news is that it is very similar to the review sheet we have been using in class – so if you can do the review sheet that I handed out, you will be mostly well prepared for the final.  However, there are two problems on the new sheet that are quite different from problems on the old sheet, #10 and #11. Here they are:

10) Of a company’s employees, 35% are women and 8% are married women.  Suppose an employee is selected at random.  Given that the selected employee is a woman, what is the probability that she is married?


ANS: 0.2286


11) A recent undergraduate student has applied to graduate schools of two universities, A and B.  The student feels that she has a 60% chance of receiving an offer from university A and a 50% chance of receiving an offer from university B.  If she receives an offer from university B, she believes that she has an 80% chance of receiving an offer from university A.
a) What is the probability that both universities will make her an offer?
b) What is the probability that at least one university will make her an offer?
c) If she receives an offer from university B, what is the probability that she will not receive an offer from university A?


ANS: a) 0.4, b) 0.7, c) 0.2

HINT:  Both of these problems rely on the formulas related to combining probabilities:

Multiplication Rule:  P(A\: and \: B) = P(A) \cdot P(B|A)
Addition Rule: P(A\: or\: B) = P(A) + P(B) - P(A\: and\: B)
Conditional Probability: P(B|A) = \frac{P(A\: and\: B)}{P(A)}


STUDY GUIDE FOR PROBLEM # 20

Dania Elder

Problem 20 :

How many 5-digit ZIP codes numbers are possible if consecutive digits must be different?

  • First by reading the problem you see there are 5 possible spaces to fill                    _ _ _ _ _
  • Next you see that consecutive digits must be different. Therefore you cannot have a zip code such as 11234, because the two 1’s are consecutive with one another.
  • So for the first spot you have 10 possible outcomes (0-9) as a zip code possibility.  10 _ _ _ _
  • The next spot cannot be the same number as the first spot so there are 9 possible out comes

10 9 _ _ _

  • And the same for the next three spaces.

10 9 9 9 9

  • Lastly, you Multiply the possible outcomes.

10*9*9*9*9 = 65,610 

Study Guide for Problem #12

Problem #(12), By Anil K. Dipu

The number of major earthquakes in a year is approximately normally distributed with a mean of 20.8 and a standard deviation of 4.5

a)    Find the probability that in a given year there will be less than 21 earthquakes.

b)    Find the probability that in a given year there will be between 18 and 23 earthquakes.

Step 1. Part (a)  List all the given facts for the first statement.

Given:

The statement says that the situation is approximately normally distributed for the number of earthquakes in a year.

This simply means that we can use the “Standard Normal Distribution Curve” for µ=0 and make it equal to the mean that it gives us to use from the statement which is 20.8 as the new µ (“Miu”-mean). Thus the curve is balanced on both sides. (see example below)

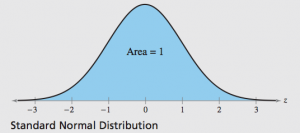
The mean is now 20.8, (µ=20.8).

The standard deviation sigma, is equal to 4.5 (σ=4.5) which we will use to find the Probability with the mean (µ=20.8)

Step 2. Analyze problem (a). And draw a standard Normal distribution curve. And label the µ and X.

In both a and b, we do not have an exact sample of population “n”, or success “p” so we do not have to use the subtraction or addition of 0.5.

Therefore we can use the normal method to find the probability with the Z score from the Standard distribution Table which only gives the probability as an area to the left of Z and X.

“Z” represents a result for a part of “1” under the normal standard distribution curve.

The “X” is a piece of data that relates to an area or fraction under the curve. It belongs to entire data series that can be near or away from the mean (µ). Though X is not area, it is a continuous a number.

For problem a, the probability must be less than the X of 2. Therefore X can be understood as less than 21

(X= less than 21).  The probability is not X and it is not 21. It is an area under the curve which is less than 21.

To find the area that of X= less than 21 we draw a standard distribution curve and label the Miu which is 20.8 as the middle or center of the data.  We mark where x is located.

As you will see, 21 is a bit further on the right side of (µ=20.8), but we need an area that is less than 21.

Since we are using a table which shows areas to the left of Z and X we have to shade or mark the area that is less than 21. The area will be on the left.

This also means that we Do Not have to subtract the final value of area from 1 since the area that is already on the left is less than the X of 21.

Step 3. Find Z and Area for probability.

We now use the regular method to find Z in order to find the value of Probability as an area which means a X=probability is less than 21.

Z= (X- µ)/ σ  = (21-20.8)/ 4.5= 0.2/4.5 =  0.0444444444444444 =0.4

(round to the nearest two decimal places after the “point or period” for z since the table uses a few decimals)

(A positive, “+” number will mean that is an area of Z which is greater than the Miu for 20.8).

Step 4. Find value of Probability with the Z score

The table that we are going to use is Table 4. We can see that 0.04 of z is an area of .5160 (=.516) which is understood as a Probability less than 21 which also on the left under the curve for normal and standard distribution.

Step 5. Part (b) List all the given facts for the first statement.

Given:

Standard Deviation is σ =4.5 and mean is µ=20.8

X is 18 and 23. The probability is supposed to be between these two data points.

Step 6. Draw the standard distribution table with the Miu and two X’s labeled.

From the standard normal distribution curve we can see that the area is between the two data points for x of 18 and 23. Therefore we need to try find the value of that area.

(Note 1: That part b did not say less than or more than so still do not need to worry about subtracting our final answer from 1, Note 2: Also since the table will always show an area that is to the left for X and Z, we are only looking at areas that concern the middle portion between the two X’s of 18 and 23. With corresponding Z’s)

Step 7. Find the two z scores, with their corresponding areas in order to find the actual difference for area of Probability.

For the first Z we use the first x of 18 and subtract Miu of 20.8, then by standard deviation 4.5.

We will now proceed as follows (18 – 20.8)/4.5 = -.062, with area of 0.2672 for A1

(For a negative value of Z, use Table 1 for area of Z less than Miu)

The second Z is the same but we use 23 for the second X.

The process will be written as (23 – 20.8)/4.5 = .49, with area of 0.6879 for  A2

Step 8. Find the probability between the two X’s of 18 and 23.

The method for probability between two values of X will be stated as follows: A2-A1

(The larger Area subtract the smaller Area)

Then we can use the table which corresponds to the new Z to find the Probability of area under the curve.

The new area is calculated by 0.6879 – 0.2676 = 0.4203

Step 9. Review, Study, & Leave A Comment if preferred.

Thankyou,

Anil

Number 19

From a standard 52 card deck what is the probability of five card hand having at least one face card?

There are 12 faces

and 40 no face cards

x>/= ( i was trying to write greater than or equal to since there is no typing symbol for both)

P (x>/=1) 1-P(o)

P(x>/=1) 1-(12C0)(40C5)/52C5

(1)(658008)/2598960=.253181273

In the calculator you use the function button of nCr

So you calculate 12 (2nd button NCR) O then times 40 (2nd button down NCR) 5

which will give you 658008

divide that number by 52C5 (52 2nd NCR) 5

which will give you 2598960

when you divide the 2 numbers you get

.253181273

you minus this number from 1

1-.253181273

which equals .7468


STUDY GUIDE PROBLEM #7

Question #7: A study group is to be selected from 5 freshman, 7 sophomores, and 4 juniors

A)   If a study group is to consist of 2 freshman, 3 sophomores, and 1 junior, how many different ways can the study group be selected?

B)   If a study group consisting of 6 students is selected, what is the probability that the group will consist of 2 freshmen, 3 sophomores and 1 junior?

 Step 1:                                         

Freshman=      5

Sophomore= +7

           Junior=   4

16

Step 2:

x=   2

X=+3

x=   1

X=  6

Step 3:

(a)  (5C2)(7C3)(4C1)= (10)(35)(4)=1400 WAYS

Answer =1400 ways

 Step 4:

(b)   P (A)= (5C2)(7C3)(4C1) divded by 16C6= 1400 over 8008= .1748

Answer =.1748


Study Guide for Problem #13

Adriana Mandelburger

I will be explaining how to solve problem #13.

Question: A professor has found that the grades on the Statistics Final are normally distributed with a mean of 68 and a standard deviation of 15. If only the best 14% of the grade in the class will receive an A, what grade must a student obtain in order to get an A?

First what we want to do is write down the information that we are given:

Mean: 68

Standard Deviation: 15

Since it is a normal distribution problem, we know that the mean (68) should be placed in the middle of the bell curve that I encourage should be drawn in order to get a better picture of what the problem is asking for. We are trying to figure out what grade should the best 14 % of students get in order to receive an A. That is another way of saying the top 14% and so, we should be shading a small area on the far right side of the mean (68) on the bell curve.

After having this drawing, we now know that we have to find the z value that corresponds to the right side of this curve. This is how we will proceed into finding this z-value:

We have to convert 14% into a decimal= .1400

Next, since we are looking for the right side value, we do the following:

1-.1400= .8600

After getting .8600, we look for the two numbers close to it in the given tables. The two numbers closest to .8600 are .8599 and .8621. From these two numbers, now we have to see which one is the closest to .8600.

.8599 is only one number away and so we choose this one to work with. From here, we look at the z-score that this area falls into, and that would be 1.08.

From here, in order to find the x value that would give us our final answer, we must use the formula x= mean + (z-score)(standard deviation).

Once we plug in the numbers, it would look like this:

x= 68 + (1.08)(15)

Now let’s solve for x, by multiplying the two numbers in the parenthesis first and then proceeding with the addition.

When solving the equation properly, x should equal 84.2

Therefore, a student must obtain at least an 84.2 in order to get an A.


Study Guide for Problem 18

a. Step 1 No replacements 11 People in Total. Only 5 can be in the Group.

Step 2 5C11

Step 3 11*10*9*8*7*6*5*4*3*2*1/ (11-5) 5*4*3*2*1

Step 4  11*10*9*8*7*6*5*4*3*2*1/ (6*5*4*3*2*1)5*4*3*2*1

Step 5 Divide like terms (6*5*4*3*2*1)

Step 6 11*10*9*8*7/5*4*3*2*1

Step 7 55440/120= 462

Answer 462

b. 11 Students in total 2 Must be Jim And Mary 5 makes a Group

Step 2 Since 2 Must be Jim And Mary we make we take it out of the total number of people and the group 11-2 = 9 and 5-2=3

Step 3 3C9

Step 4 9*8*7*6*5*4*3*2*1/(9-3) 3*2*1

Step 5 9*8*7*6*5*4*3*2*1/6*5*4*3*2*1 *3*2*1

Step 6 Divide like Terms 6*5*4*3*2*1

Step 7 9*8*7/ 3*2*1

Step 8    504/6 =84

Answer 84

Study Guide For Problem #4


Erica Press

Question #4:
4) There is 1 red ball, 1 blue ball, and 1 yellow ball in a hat. Two balls are selected. Construct a tree diagram and list the sample space if the selection is done
a) with replacement.
b) without replacement.

Solution: 

First, let’s look at the information that is given to us by the problem.

  • 1 Red Ball
  • 1 Blue Ball
  • 1 Yellow Ball
  • 2 Balls are selected (with/without replacement)

In order to solve this problem, we first must recognize that it is a two part question. We must construct a tree diagram and list the sample space, but in two different ways. The first is with replacement, meaning that after we pull a ball out of the hat, we replace it within the hat. This just means that it remains available to be pulled from the hat again. The second way is without replacement, meaning that after the ball it pulled from the hat, it is not returned and it is no longer possible to select that ball.

This is a problem that is easier to understand with a visual aid. I have attached a photo of the tree diagram and sample size for with and without replacement. In order to make things easier, I color coded the tree diagram – but don’t get confused, I used green instead of yellow as it would have been more difficult to read.

Step 1: Let’s create the tree diagram and sample size for the trial with replacement first.

In order to do so, we first start with the root of the tree – a single point that separates into our first number of trials. The first trial accounts for each ball that can be grabbed the first time. One red, one blue, or one yellow. However, if you are replacing that ball, it can be grabbed again during the second selection. Therefore, each of the existing three colors should branch off into three more options. The three options for each of the existing three should also be one red, one blue, and one yellow. For example, because the ball is replaced, if you grab a red ball the first time, you can grab a red ball again the second time, etc. There should be nine options total in the second trial, three for each of the three from the first trial.

The sample size can be listed from the tree diagram. For example, just read through each branch of the diagram and account for every possible selection.

Step 2: In order to create the tree diagram for each trial without replacement, after the first trial, omit the same color ball for the second trial. This means that because the balls are not  replaced, you can only grab the first color once and there is no chance of grabbing it again. To explain further, once again you will have three balls for your first trial – one red, one blue, and one yellow. However, because you are not replacing the ball, each second trial will only branch off into two other options – the colors that were NOT grabbed on the first trial. So, instead of nine options for the second trial, three are no longer an option, meaning that there should be six. If this doesn’t make sense, take a look at the picture I attached – as I said, it is much easier to understand this sort of problem with help of a visual aid.

If there are any questions, feel free to ask and I will post a reply in attempt to clarify.