
Consumer Spending Ticks Up, and Housing Market Is Poised for Gains – By THE ASSOCIATED PRESSMARCH 30, 2015
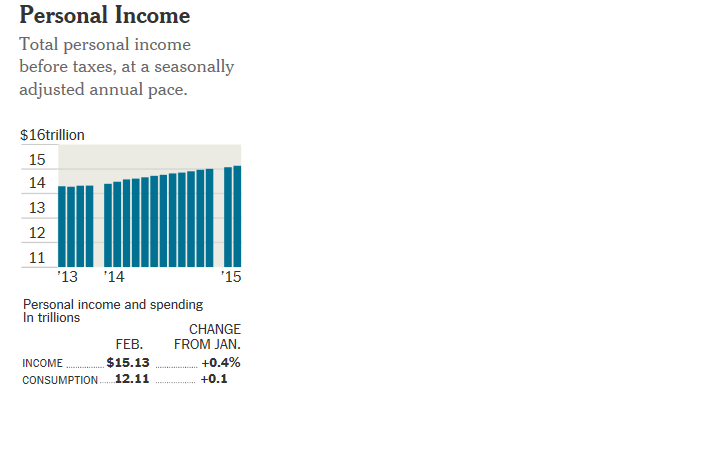
Consumers spent slightly more in February even though their income rose by a healthy amount. Consumer spending edged up 0.1 percent after declines of 0.2 percent in both January and December, the Commerce Department reported Monday. The result reflected a 0.4 percent increase in spending on nondurable goods, like food and energy, together with a 0.1 percent fall in durable goods like automobiles. Falling gas prices and continued growth in employment set the stage for stronger consumer spending in the months ahead. Severe winter weather kept shoppers away from malls and auto showrooms in both January and February. The weather-related weakness is expected to reduce overall economic growth during the January-March quarter. The graph is showing the total personal income at a seasonally pace from the years 2013-2015. As you could see the change of income from January is about 0.4 %.
– Christopher Narain


This looks to me more of a copy-paste than a summary. Can you provide a link to the article? Make this personal. How do you think the graph was used in the article? Can you say anything about how the topic relates to your own situation? Your family’s?